Macro Theme:
Key dates ahead:
- 12/1: ISM PMI
- 12/2: JOLTS
- 12/5: PCE
- 12/10: CPI/FOMC
- 12/15: ORCL ER
- 12/16: NFP
- 12/17 VIX Exp
- 12/19: OPEX
SG Summary:
Update 12/5: We are more cautious of markets to start the week of 12/1 due to a deluge of upcoming data, culminating on 12/5 with PCE+NFP. This caution has us more positioned for chop and/or mild downside vs looking for major equity upside. Given this, we move our Risk Pivot up to 6,775 with eyes on 6,700 as more material support. Into 12/5 and FOMC on 12/10 we anticipate an opportunity for resumption of the upside trend, and while that is what we anticipate we’ll look for positive gamma into those events to give us the green light.
Key SG levels for the SPX are:
- Resistance: 6,810, 6,850, 6,900
- Pivot: 6,775 (bearish <, bullish >)
- Support: 6,775, 6,700
Founder’s Note:
Futures are 20bps higher, with JOLTS at 8:30AM ET.
Overall positioning is light. SPX gamma above is largely negative to 6,850, which is resistance for today. 6,800 is key support, with mild positive gamma at that level. 6,775 remains our Risk Pivot, with a break of that level likely triggering a larger downside move to 6,700.
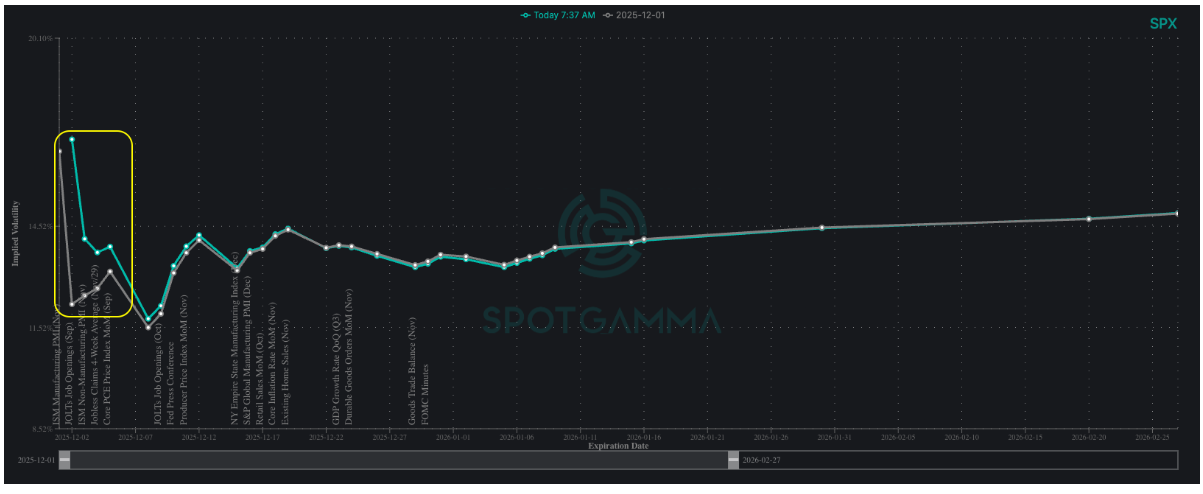
We find SPX vols >=1-week very much unchanged despite yesterday’s sharp afternoon selloff, as SPX still holds the 6,800 level. Short dated IV’s are up a bit in anticipation of incoming data
Here we show the event volatility premium tied to upcoming data, wherein we see both PMI and PCE commanding a mild premium this week, with next weeks CPI/FOMC and PPI/NFP prints drawing larger relative consternation. This lines up with our forecast of sticky vol/chop into next weeks FOMC, which can be the clearing mechanism for elevated vols and offer a final year end move to 7,000. As long as SPX is above our Risk Pivot, currently 6,775, then we favor this upside move.
On the singe stock side, there is a lot of dispersion. Some top names are holding fairly bullish stances (right side of Compass), and some bearish (left side). MRVL & CRWV report tonight, with ORCL on 12/9, both of which can be triggers for the semi/AI trade.
There are two interesting trades we are looking at. First, SLV (yellow), we are looking at buying put flies to bet on mean reversion in SLV price as well as implied volatility contraction. As you can see, the IV is near 100% rank due to upside movement in SLV prices.
Second is MSTR, wherein call flies are interesting, as a bounce in the stock could lead to gains and contraction in volatility, too. We do not like the short puts & short put vol in MSTR due to the wild dynamics & related downside risks in play.
©2025 TenTen Capital LLC DBA SpotGamma
All TenTen Capital LLC DBA SpotGamma materials, information, and presentations are for educational purposes only and should not be considered specific investment advice nor recommendations. Futures, foreign currency and options trading contains substantial risk and is not for every investor. An investor could potentially lose all or more than the initial investment. Risk capital is money that can be lost without jeopardizing one’s financial security or lifestyle. Only risk capital should be used for trading and only those with sufficient risk capital should consider trading. Past performance is not necessarily indicative of future results. VIEW FULL RISK DISCLOSURE https://spotgamma.com/model-faq/disclaimer/
|
| /ESZ25 | SPX | SPY | NDX | QQQ | RUT | IWM |
|---|---|---|---|---|---|---|---|
| Reference Price: | $6822.74 | $6812 | $680 | $25342 | $617 | $2469 | $245 |
| SG Gamma Index™: |
| 1.934 | 0.018 |
|
|
|
|
| SG Implied 1-Day Move: |
| 0.62% | 0.62% |
|
|
|
|
| SG Implied 5-Day Move: |
| 1.73% |
|
|
|
|
|
| SG Implied 1-Day Move High: |
| $6874.61 | $686.13 |
|
|
|
|
| SG Implied 1-Day Move Low: |
| $6789.89 | $677.67 |
|
|
|
|
| SG Volatility Trigger™: | $6795.74 | $6785 | $678 | $25190 | $615 | $2475 | $245 |
| Absolute Gamma Strike: | $7010.74 | $7000 | $680 | $24500 | $620 | $2500 | $240 |
| Call Wall: | $7010.74 | $7000 | $700 | $23950 | $630 | $2600 | $250 |
| Put Wall: | $6510.74 | $6500 | $670 | $24750 | $590 | $2420 | $235 |
| Zero Gamma Level: | $6732.74 | $6722 | $679 | $24900 | $611 | $2463 | $247 |
| Key Support & Resistance Strikes |
|---|
| SPX Levels: [7000, 6800, 6700, 6000] |
| SPY Levels: [680, 670, 700, 685] |
| NDX Levels: [24500, 25500, 25000, 26000] |
| QQQ Levels: [620, 600, 630, 610] |
| SPX Combos: [(7126,69.17), (7099,95.69), (7078,86.86), (7051,93.60), (7024,81.89), (7010,88.77), (7003,99.79), (6983,72.46), (6976,88.92), (6969,85.50), (6963,80.44), (6949,97.93), (6942,81.91), (6928,81.36), (6922,96.94), (6908,94.27), (6901,99.54), (6888,89.23), (6881,95.20), (6874,91.34), (6867,97.48), (6860,87.90), (6854,71.22), (6847,99.22), (6840,87.62), (6833,83.11), (6826,74.91), (6799,93.65), (6772,87.67), (6758,86.02), (6738,77.57), (6731,75.10), (6717,75.33), (6710,83.51), (6697,88.89), (6683,71.75), (6663,76.86), (6649,88.39), (6622,68.31), (6608,76.50), (6601,76.12), (6547,77.25), (6513,78.27), (6499,94.50)] |
| SPY Combos: [679.29, 686.12, 686.81, 688.17] |
| NDX Combos: [24228, 25875, 25470, 26281] |
| QQQ Combos: [629.78, 590.15, 640.3, 619.87] |

0 comentarios