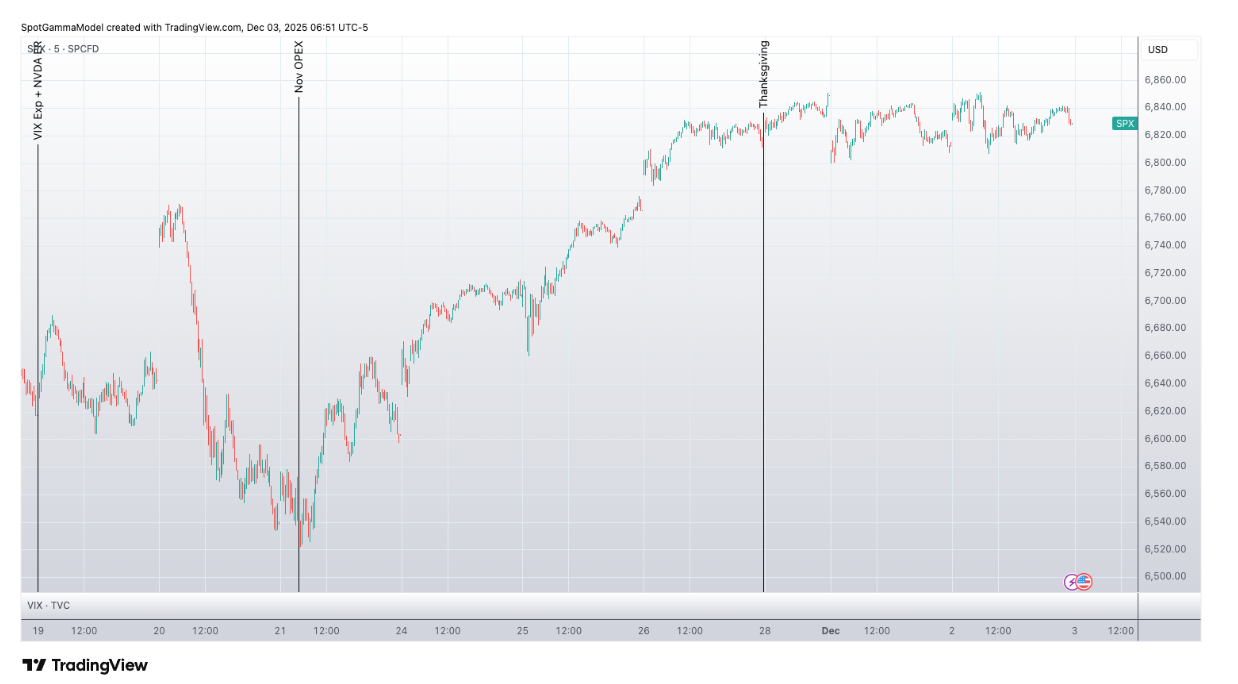
Macro Theme:
Key dates ahead:
- 12/3: ADP, ISM Services PMI
- 12/5: PCE (confirmed)
- 12/10: FOMC
- 12/15: ORCL ER
- 12/16: NFP
- 12/17 VIX Exp
- 12/18: CPI (confirmed)
- 12/19: OPEX
SG Summary:
Update 12/5: We are more cautious of markets to start the week of 12/1 due to a deluge of upcoming data, culminating on 12/5 with PCE+NFP. This caution has us more positioned for chop and/or mild downside vs looking for major equity upside. Given this, we move our Risk Pivot up to 6,775 with eyes on 6,700 as more material support. Into 12/5 and FOMC on 12/10 we anticipate an opportunity for resumption of the upside trend, and while that is what we anticipate we’ll look for positive gamma into those events to give us the green light.
Key SG levels for the SPX are:
- Resistance: 6,850, 6,900
- Pivot: 6,775 (bearish <, bullish >)
- Support: 6,800, 6,775, 6,700
Founder’s Note:
Futures are 10 bps higher, with ADP employment at 8:15AM ET and ISM PMI at 10AM ET.
We note MRVL reported last night, and is +10%, which bolsters the semi/AI story.
Key support remains at 6,800, with resistance at 6,850 then 6,900. The Risk Off Pivot holds at 6,775.
While the SPX gained 5% from Nov OPEX to Black Friday, the last two sessions have brought a tight trading range from 6,800 to 6,850. Today’s SPX straddle is a very tight $29/42bps, which implies that today’s ISM Services PMI is a non-event. On this topic, you will occasionally see the 0DTE SPX straddle in the high 30bps, but thats as low as it gets. Overall this signals that short 0DTE vol/options is not a great strategy, unless you can play credit spreads into a fast move down into 6,800/up into 6,900.
SPX vols are also unchanged since Friday’s close, as you can see with this AM’s vol (teal) vs Friday’s close (gray). This highlights vanna has been removed from the equation after being such a dominant force during the November vol collapse (VIX ~25->17).
As discussed yesterday (and several times over the past 2 weeks), the movement of vol is tied to upcoming data/events, with the QQQ event volatility defined below. As highlighted above, today’s straddle is about as tight as it gets, suggesting no event premium today and therefore we don’t have much of an expectation for SPX >50bps of SPX movement.
Given the anticipation of another quiet day, we turn to single stocks.
Two names highlighted yesterday, SLV & MSTR, have shifted slightly in favorable directions for put flies & call flies, respectively. We think that these trades are still viable if/when implied vols decline (see y’days note).
We are also now eyeing TSLA/PLTR (and to a lesser extent SPY/QQQ/IWM) as long options plays into the end of December, given they scan as low IV rank (bottom of Compass). While we are looking to lean long into EOY due to SPX >6,800 and the drop in event vols over the next week (making TSLA/PLTR calls viable), traders can also buy put options in these names if they want to express downside. Again, this is about end-of-year setup, as we think chop/grind could prevail into at least end-of-week if not until next weeks FOMC.
©2025 TenTen Capital LLC DBA SpotGamma
All TenTen Capital LLC DBA SpotGamma materials, information, and presentations are for educational purposes only and should not be considered specific investment advice nor recommendations. Futures, foreign currency and options trading contains substantial risk and is not for every investor. An investor could potentially lose all or more than the initial investment. Risk capital is money that can be lost without jeopardizing one’s financial security or lifestyle. Only risk capital should be used for trading and only those with sufficient risk capital should consider trading. Past performance is not necessarily indicative of future results. VIEW FULL RISK DISCLOSURE https://spotgamma.com/model-faq/disclaimer/
|
|
/ESZ25 |
SPX |
SPY |
NDX |
QQQ |
RUT |
IWM |
|---|---|---|---|---|---|---|---|
|
Reference Price: |
$6840.04 |
$6829 |
$681 |
$25555 |
$622 |
$2464 |
$245 |
|
SG Gamma Index™: |
|
2.363 |
0.082 |
|
|
|
|
|
SG Implied 1-Day Move: |
|
0.62% |
0.62% |
|
|
|
|
|
SG Implied 5-Day Move: |
|
1.73% |
|
|
|
|
|
|
SG Implied 1-Day Move High: |
|
$6860.72 |
$684.78 |
|
|
|
|
|
SG Implied 1-Day Move Low: |
|
$6776.18 |
$676.34 |
|
|
|
|
|
SG Volatility Trigger™: |
$6806.04 |
$6795 |
$679 |
$25190 |
$619 |
$2475 |
$245 |
|
Absolute Gamma Strike: |
$7011.04 |
$7000 |
$680 |
$24500 |
$630 |
$2500 |
$240 |
|
Call Wall: |
$7011.04 |
$7000 |
$700 |
$25600 |
$630 |
$2600 |
$250 |
|
Put Wall: |
$6511.04 |
$6500 |
$670 |
$24750 |
$590 |
$2420 |
$235 |
|
Zero Gamma Level: |
$6749.04 |
$6738 |
$680 |
$25110 |
$616 |
$2459 |
$246 |
|
Key Support & Resistance Strikes |
|---|
|
SPX Levels: [7000, 6800, 6700, 6000] |
|
SPY Levels: [680, 670, 700, 685] |
|
NDX Levels: [24500, 25500, 25600, 26000] |
|
QQQ Levels: [630, 620, 600, 625] |
|
SPX Combos: [(7150,88.08), (7123,75.47), (7103,96.17), (7075,84.40), (7048,94.38), (7027,86.58), (7014,88.26), (7000,99.86), (6993,73.64), (6973,97.05), (6966,76.03), (6952,98.93), (6939,77.89), (6932,89.90), (6925,95.13), (6918,89.23), (6911,92.90), (6904,84.23), (6898,99.69), (6891,88.25), (6884,90.73), (6877,99.23), (6870,88.38), (6864,97.63), (6857,91.09), (6850,98.35), (6843,89.43), (6823,75.21), (6802,89.00), (6795,68.10), (6775,74.16), (6768,80.32), (6761,77.17), (6747,83.39), (6727,86.39), (6713,84.31), (6700,86.69), (6672,68.16), (6665,72.01), (6652,90.07), (6611,71.53), (6597,74.45), (6549,78.39), (6515,71.52), (6502,93.78)] |
|
SPY Combos: [699.32, 689.11, 683.67, 693.88] |
|
NDX Combos: [25888, 26297, 26093, 25607] |
|
QQQ Combos: [590.01, 630.13, 620.26, 640.01] |

0 comentarios