Macro Theme:
Short Term SPX Resistance: 4,600
Short Term SPX Support: 4,500
SPX Risk Pivot Level: 4,500
Major SPX Range High/Resistance: 4,600
Major SPX Range Low/Support: 4,200
‣ We anticipate the equity market high being Wednesday AM 11/15, with consolidation happening into & around 11/17th (Equity OPEX).
‣ This would clear the way for a final, year end rally. 4,600 is our current upside target, following the major CPI rally.*
‣ RUT/IWM could outperform SPX/SPY into year due to the change in options positions into Nov OPEX.**
*updated 11/15
**updated 11/16
Founder’s Note:
ES Futures are flat at 4,560. Key SG levels for the SPX are:
- Support: 4,525, 4,500, 4,475
- Resistance: 4,550, 4,558, 4,600
- 1 Day Implied Range: 0.82%
In QQQ our
Call Wall
resistance remains at 390, with support at 385.
TLDR: Our IV metrics are showing overbought conditions. Our view heading into the last several days was for some consolidation and mean reversion in equities, but that have largely moved higher. Accordingly, the SPY & SPX
Call Walls
have rolled higher, to 460/4,600, respectively. This area is now the top of our range, and we remain bullish while the SPX is >= our Vol Trigger level of 4,495. Below this is where we mark “risk off”.
We start today with our SPX Risk Reversal[RR], which is just off of its highs since our data beings (Jan ’18). This metric measures the value of a 1-month 25 delta put, vs a 1-month 25 delta call, and a high reading informs us that calls are at high IV’s relative to puts. We’d frame this as an overbought condition, which syncs with similar RR highs in top names like: MSFT, AAPL, GOOGL.

Shown here is the SDEX index, which measures the value of a 1-month at-the-money SPY put, vs a 1-month “one standard deviation out-of-the-money” put. This syncs with the data above, in that it reflects put prices are sliding markedly lower.

Hammer
ing home this point is a view of 30 days-to-expiration SPX skew, which compares todays reading (pink) vs mid Sep (gray), which was the last time VIX was <=14. As you can see, current +2% OTM calls have a higher IV now (green box), which signals more relative call demand. Conversely, the downside shows lower relative IV’s (green arrow).

There is an interesting symmetry between this IV call skew, and SPX prices. The last time we saw these conditions was in July of this year, where in there was tremendous bidding across AI-related names. This corresponded with the SPX rallying to 4,600 – just ~1% from current levels. From July to mid-August the SPX slid -5%, as shown below.

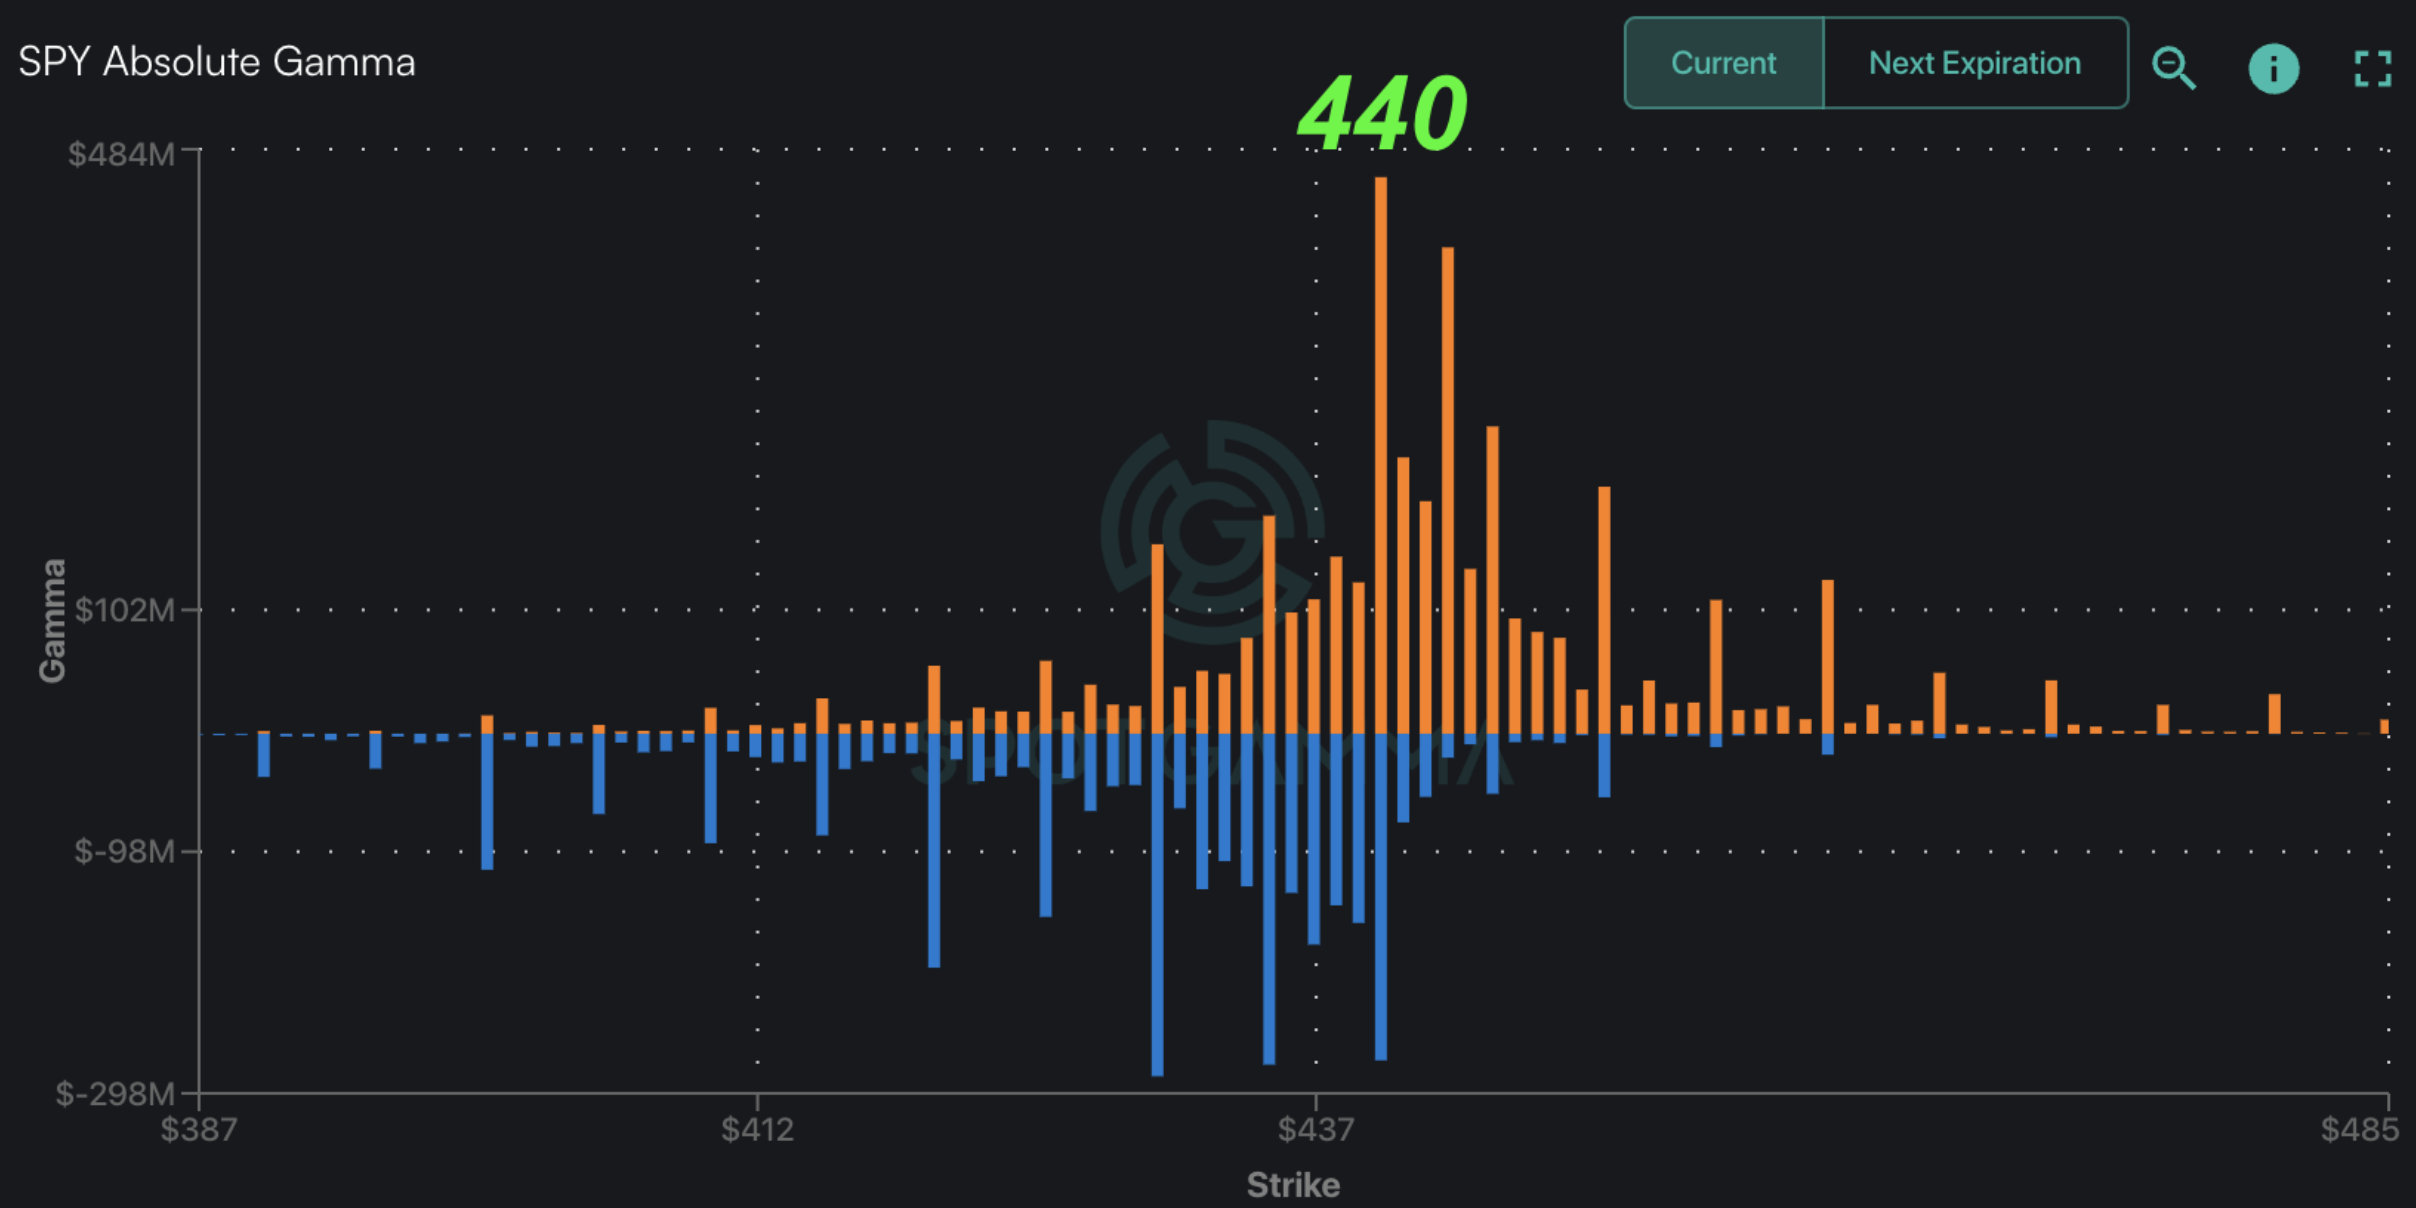
Our other topping concern here is with open interest. Shown below is gamma positioning in SPX, and as you can see there is very little
call gamma
>=4,600 (that previous high from above), which suggests a lack of call positions at those upside strikes. A similar phenomenon exists >=400 in QQQ, too. We want to see call positions build up and increasing higher strikes, as that interest serves to support higher equity prices.

As most of you are aware, conditions can remain overbought for some time, and being under-allocated during these periods can be quite painful. However, when you have periods like this wherein the SPX rallies +10% <1 month, there can often be some very nasty mean reversion.
The way that we navigate these situations is through our
Volatility Trigger
metric (currently 4,495). This SG level is where we generally believe dealers shift from an equity-supportive, positive gamma stance, to a negative gamma stance. Transitions from positive gamma to negative gamma regimes often begin with a bout of heavy equity selling. This levels acts something like a moving average in that it shifts with SPX prices, however its calculated strictly through the changes in gamma positioning & IV.
Holding a bullish stance while SPX is >VT should allow us to participate in further upside, with a moving stop.
Here are the forward returns for when the SPX closes < Vol Trigger (bottom), vs all returns (top). As you can see, there SPX exhibits higher volatility across time frames after a close below the Vol Trigger. And, this is the purpose of the Vol Trigger – to mark the onset of volatility.
It generally speaking is not a strong directional barometer because over time the SPX exhibits strong mean reversions. In other words, historically stocks crash violently, but then rally back, and this movement all happens < the Vol Trigger. Therefore we like to use the Vol Trigger as a “risk off” metric, but then look at our
Put Walls
or Tilt indicators for a bottoming signal.

You can view charts of the SPX/Vol Trigger, as well as download this data via the “SPX Historical Chart”, located at the very bottom of this page.
|
SpotGamma Proprietary Levels |
SPX |
SPY |
NDX |
QQQ |
RUT |
IWM |
|---|---|---|---|---|---|---|
|
Reference Price: |
$4547 |
$454 |
$16027 |
$390 |
$1807 |
$179 |
|
SpotGamma Implied 1-Day Move: |
0.82% |
1.18% |
|
|
|
|
|
SpotGamma Implied 5-Day Move: |
1.87% |
|
|
|
|
|
|
SpotGamma Volatility Trigger™: |
$4495 |
$449 |
$15250 |
$379 |
$1770 |
$177 |
|
Absolute Gamma Strike: |
$4500 |
$450 |
$15825 |
$390 |
$1800 |
$180 |
|
SpotGamma Call Wall: |
$4600 |
$460 |
$15825 |
$390 |
$1860 |
$182 |
|
SpotGamma Put Wall: |
$4300 |
$400 |
$14000 |
$345 |
$1700 |
$170 |
|
Additional Key Levels |
SPX |
SPY |
NDX |
QQQ |
RUT |
IWM |
|---|---|---|---|---|---|---|
|
Zero Gamma Level: |
$4487 |
$446 |
$14827 |
$381 |
$1789 |
$176 |
|
Gamma Tilt: |
1.394 |
1.481 |
2.15 |
1.435 |
1.058 |
1.243 |
|
SpotGamma Gamma Index™: |
2.023 |
0.258 |
0.089 |
0.109 |
0.005 |
0.037 |
|
Gamma Notional (MM): |
$780.036M |
$1.12B |
$11.427M |
$568.145M |
$7.095M |
$454.873M |
|
25 Day Risk Reversal: |
-0.022 |
-0.033 |
-0.023 |
-0.027 |
-0.009 |
-0.02 |
|
Call Volume: |
548.619K |
1.66M |
14.699K |
821.684K |
24.058K |
439.858K |
|
Put Volume: |
930.469K |
2.574M |
15.024K |
1.022M |
25.45K |
302.021K |
|
Call Open Interest: |
6.946M |
6.809M |
56.533K |
4.327M |
277.355K |
5.062M |
|
Put Open Interest: |
12.815M |
12.396M |
64.962K |
7.675M |
438.392K |
7.60M |
|
Key Support & Resistance Strikes |
|---|
|
SPX Levels: [4600, 4550, 4500, 4400] |
|
SPY Levels: [460, 455, 450, 440] |
|
NDX Levels: [16000, 15825, 15500, 15000] |
|
QQQ Levels: [400, 390, 385, 380] |
|
SPX Combos: [(4752,95.19), (4725,78.02), (4702,97.57), (4675,84.86), (4652,95.69), (4638,72.44), (4625,95.56), (4611,77.57), (4606,95.19), (4602,99.67), (4593,73.19), (4588,84.47), (4584,83.47), (4579,80.84), (4575,99.01), (4570,89.88), (4566,88.23), (4561,79.59), (4556,95.44), (4552,99.68), (4543,80.23), (4538,86.89), (4534,76.83), (4529,81.53), (4525,96.05), (4520,78.15), (4516,97.12), (4511,75.44), (4506,74.23), (4502,97.07), (4452,76.51), (4402,87.27), (4352,81.64)] |
|
SPY Combos: [458.66, 455.02, 461.39, 463.66] |
|
NDX Combos: [15819, 15995, 16412, 16203] |
|
QQQ Combos: [390.49, 394.79, 404.95, 399.87] |
SPX Gamma Model
Strike: $4,911
- Next Expiration: $674,496,415
- Current: $674,918,835
View All Indices Charts