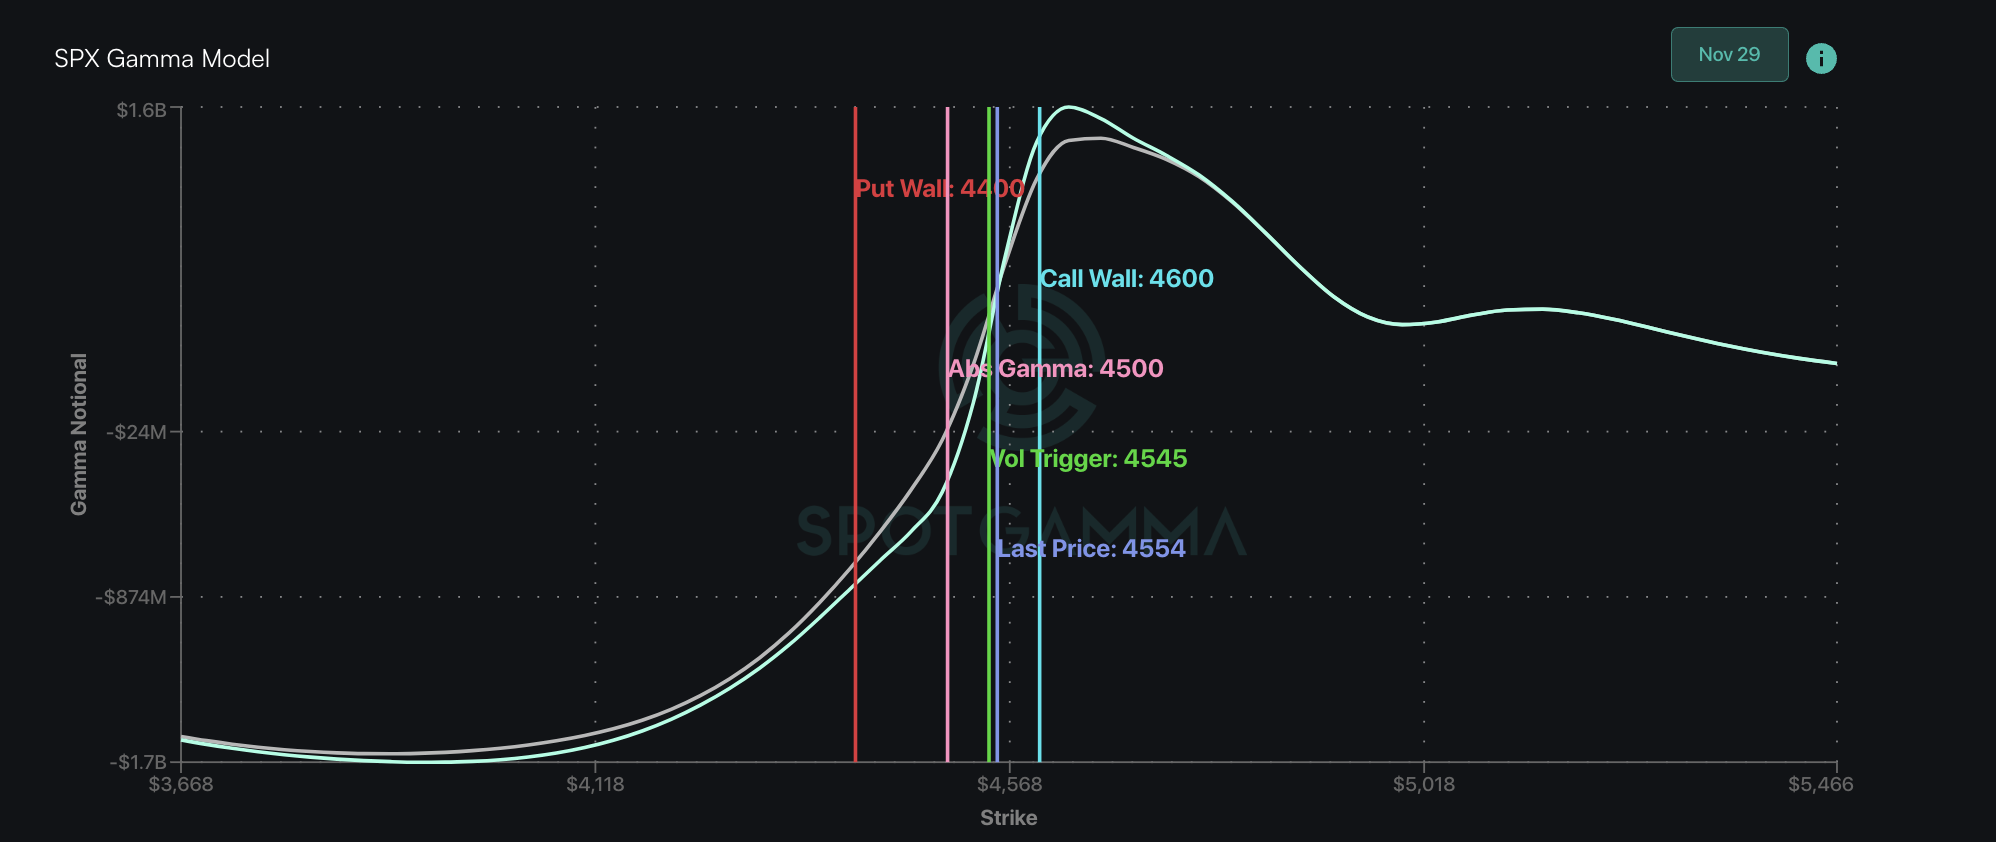
Macro Theme:
Short Term SPX Resistance: 4,569
Short Term SPX Support: 4,525
SPX Risk Pivot Level: 4,500
Major SPX Range High/Resistance: 4,600
Major SPX Range Low/Support: 4,200
‣ IV levels are anemic (~8%), which suggests that a pop higher in IV/equity downside is due. A break of 4,500 is our “risk off” level.*
‣ 4,600 is our current max upside target, as call positions are not yet building above that level.*
*updated 11/30
Founder’s Note:
ES Futures are slightly higher 4,560. Key SG levels for the SPX are:
- Support: 4,546, 4,523, 4,514, & 4,500
- Resistance: 4,560, 4,569, 4,600
- 1 Day Implied Range: 0.62%
For QQQ resistance is at 389/390, then 395. Support is at 383.
Today, the last day of November, features core PCE and Jobless claims at 8:30 AM ET. Tomorrow Powell speaks at 11 AM ET.
TLDR: Our models are pricing in tight SPX ranges for the day (62 bps). This suggests trading intraday mean reversion (buying dips and selling rips) is still in favor. While this is what our models suggest, we are still of the view that equities are overall due for a pullback, with 4,500 the target area. Therefore we are favoring “selling rips” as opposed to buying shallow dips.
As we discussed last night, yesterdays AM rally was met with heavy negative delta flow, as traders bought puts & sold calls not only in the S&P(purple line, below), but QQQ & Mag 7, too. In fact, it was the most negative delta trading session for the Mag7 in the last 30 days, and every one of the Magnificent 7 stocks finished the session with net negative
HIRO
signals.
That heavy negative delta flow hit at the exact wick of this all-time-high candle of the MGK (Mega Cap Growth ETF “Mag 7” ETF). Quite interesting…
The other interesting element to yesterdays price action was the volatility. Yes, the SPX closed just -10bps on the day, but that flat close masked’s a very sharp 80bps round trip from early AM highs to the closing lows. This resulted in the VIX sliding higher, to 13 (lower pane).
80bps may not sound like much, but its a standout day in what has been a very dull trading environment. You can see this in the 5 day SPX plot, below.
The SPX has done exactly nothing since we called for a pullback last Friday. However, the rejection of yesterdays highs, and subtle slide higher in volatility helps us to retain our view for lower equity prices.
As the S&P500 moved to 4550, it’s corresponded with volatility making significant lows (see here). With this, our view has been/is that the supply of large positive gamma strikes above which should continue to hold down upside movement, therein making it easier for volatility to express itself to the downside.
Many of our recent notes have chronicled how traders are pricing volatility to perfection, with IV’s at ~8%. 8% IV’s imply 50-60bps 1 day moves in the S&P500 – a level that is not hard for the SPX to break (as seen in the 80bps move yesterday). If you’re holding a volatility short, betting on <50bps of SPX movement, and you are suddenly delivered 80 bps of movement, you may have to cover. It’s that covering action is enough to in and of itself expand volatility, and we can’t help but wondering if we saw some tremor’s of this volatility covering flow yesterday.
With this, we continue to target an SPX pullback to the 4,500 area.
|
SpotGamma Proprietary Levels |
SPX |
SPY |
NDX |
QQQ |
RUT |
IWM |
|---|---|---|---|---|---|---|
|
Reference Price: |
$4550 |
$454 |
$15987 |
$389 |
$1803 |
$178 |
|
SpotGamma Implied 1-Day Move: |
0.62% |
0.62% |
|
|
|
|
|
SpotGamma Implied 5-Day Move: |
2.09% |
|
|
|
|
|
|
SpotGamma Volatility Trigger™: |
$4560 |
$456 |
$15260 |
$389 |
$1770 |
$177 |
|
Absolute Gamma Strike: |
$4500 |
$455 |
$15825 |
$390 |
$1800 |
$180 |
|
SpotGamma Call Wall: |
$4600 |
$460 |
$15825 |
$400 |
$1800 |
$185 |
|
SpotGamma Put Wall: |
$4530 |
$452 |
$14000 |
$360 |
$1700 |
$170 |
|
Additional Key Levels |
SPX |
SPY |
NDX |
QQQ |
RUT |
IWM |
|---|---|---|---|---|---|---|
|
Zero Gamma Level: |
$4524 |
$453 |
$15015 |
$389 |
$1786 |
$177 |
|
Gamma Tilt: |
1.127 |
0.904 |
2.077 |
1.034 |
0.994 |
1.171 |
|
SpotGamma Gamma Index™: |
0.864 |
-0.10 |
0.104 |
0.014 |
-0.001 |
0.029 |
|
Gamma Notional (MM): |
$374.045M |
‑$302.085M |
$13.22M |
$104.084M |
$3.449M |
$392.652M |
|
25 Day Risk Reversal: |
-0.015 |
-0.025 |
-0.015 |
-0.019 |
-0.004 |
-0.016 |
|
Call Volume: |
640.075K |
1.824M |
12.699K |
782.551K |
40.678K |
592.874K |
|
Put Volume: |
901.991K |
2.127M |
11.623K |
1.281M |
45.669K |
626.541K |
|
Call Open Interest: |
7.30M |
7.31M |
59.833K |
4.49M |
287.521K |
5.348M |
|
Put Open Interest: |
13.186M |
13.635M |
68.904K |
8.215M |
438.394K |
7.806M |
|
Key Support & Resistance Strikes |
|---|
|
SPX Levels: [4600, 4550, 4500, 4400] |
|
SPY Levels: [460, 456, 455, 450] |
|
NDX Levels: [16000, 15825, 15500, 15000] |
|
QQQ Levels: [390, 388, 385, 380] |
|
SPX Combos: [(4774,77.47), (4751,94.88), (4724,81.45), (4705,79.55), (4701,98.17), (4673,90.76), (4655,78.39), (4651,97.35), (4642,79.70), (4628,79.53), (4623,97.79), (4619,80.56), (4614,81.01), (4610,93.71), (4605,96.00), (4601,99.75), (4596,85.32), (4592,89.31), (4587,84.83), (4582,76.28), (4578,78.28), (4573,98.63), (4569,94.42), (4551,82.93), (4546,95.66), (4541,93.95), (4537,79.63), (4532,81.30), (4528,95.52), (4523,96.98), (4519,87.96), (4514,93.93), (4510,79.13), (4505,89.01), (4496,77.84), (4473,73.53), (4400,92.01), (4350,83.81)] |
|
SPY Combos: [459.56, 456.83, 469.57, 461.84] |
|
NDX Combos: [15828, 16403, 16195, 15908] |
|
QQQ Combos: [386.02, 400.48, 395.4, 393.44] |
SPX Gamma Model
View All Indices Charts

0 comentarios