
Macro Theme:
Key dates ahead:
- 2/25: NVDA, CRM ER
- 2/26: Core PCE
SG Summary:
Update 2/20: We’ve moved our Risk Pivot to 6,800. This is because of the strong stats we are going to outline below, which all point to a bullish bounce next week. We quite frankly feel like something nefarious is afoot, but feelings aren’t valid. Sub 6,800 we will very quickly flip to neutral and/or bearish of stocks.
2/17: We are on high alert that Wed VIX expiration – Friday’s OPEX opens a window of weakness that may finally allow SPX vols to match the high vols seen in single stocks. A break of SPX <6,800 is our “high risk” signal.
Key SG levels for the SPX are:
- Resistance: 6,900
- Pivot: 6,800 (bearish <, bullish >) NEW Updated 2/20
- Support: 6,800, 6,700, 6,650
Founder’s Note:
Futures are off 20bps, which is an improvement from overnight -100bps.
Wed PM NVDA earnings is the big concrete data point this week. There are less tangible risks: tariffs, Iran, Mexico…likely don’t matter until they matter.
Post-OPEX we remain staunchly back to the place which has been so tough to overcome: 6,900. Currently we see 0DTE positive gamma above that strike, which offers positive gamma resistance. <6,900 we see negative gamma, and that negative gamma increases into the 6,600s. Note that if you remove 0DTE, you see gamma for the SPX is negative across the board. What’s the takeaway here?
We’ll, on Friday we showed how the stats all pointed to a bullish outcome out of OPEX, despite our “feelings” to the contrary. As it stands, the negative gamma below presents a soft underbelly to this market – but that dynamic is no different from that of recent weeks (if not months). Positive gamma has persistently been placed above and into the 7k area, which provides resistance. The SPX has not been able to overcome this resistance.

Vol is also in a weird spot. VIX 20 is the staging area for crashing – which isn’t great. However, with 1-month SPX IV at ~14%, one could argue there is some vol premium to crush. Decent NVDA news and the decaying of any small Iran risk probably allows that vol premium to shrink. TBD.
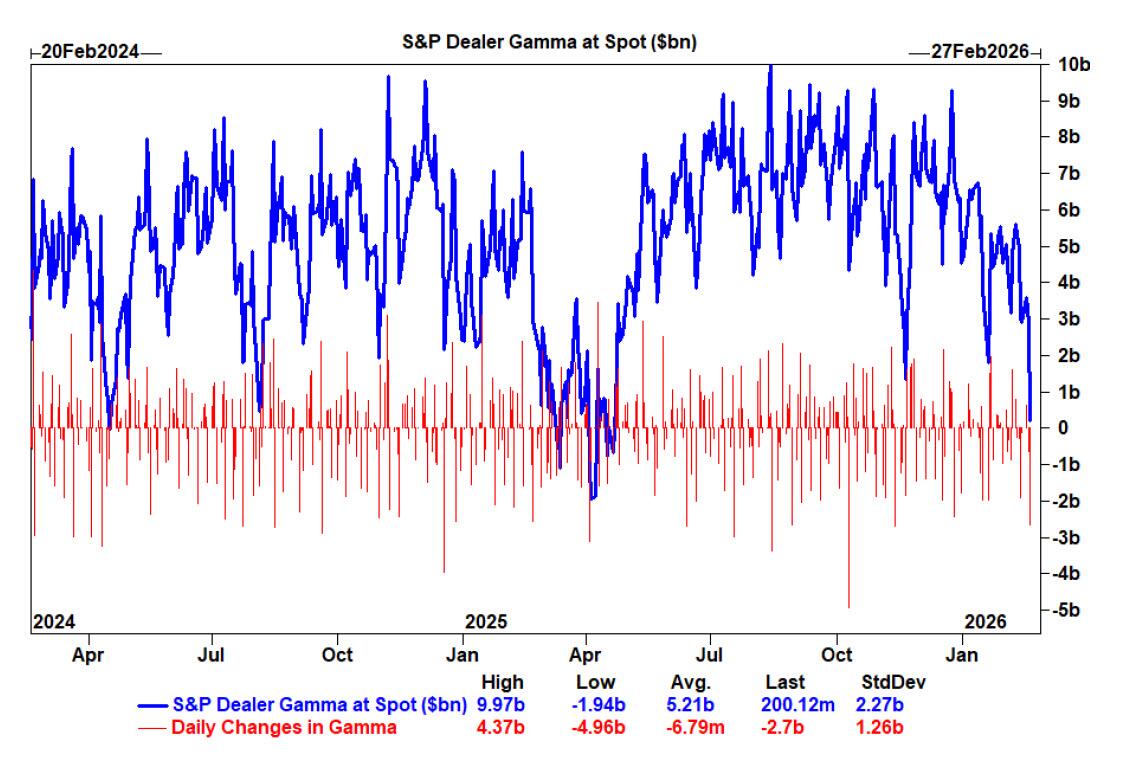
Lastly, this GS gamma chart is making the rounds. Last week is was some chart crimes related to PC ratios that went viral, now it’s “zero gamma”.
A few things on this:
- Its not terribly clear what “S&P Dealer Gamma” is. Our models for SPX is above, and we’ve not seen +4bn of positive SPX gamma in some time. We assume its some kind of aggregate across stocks and S&P. We model SPY as largely negative gamma ($-4bn), and then single stocks were largely positive due to buyside selling puts, which is where we think the GS model was picking up positive gamma. Friday’s OPEX removed a lot of that single stock positive gamma.
- The zero gamma on these charts coincides, and we’d argue is linked to major drawdowns (3% in April ’24, 5% in July ’24, then tariffs in April ’25, etc). Perma-bears love this chart because it suggests huge volatility is ahead – and based on the sample size of 3 it seems that maybe equities bounce out of these zero gamma events.
- What’s different here is the dispersion: single stocks are telling a different story relative to index. IF the big single stock positive gamma was being held up by Feb OPEX, then you would think single stock vol would maybe now pick back up, or index vol will increase to sync with single stock vol.
Ultimately we covered these angles on Friday AM, the TLDR remains the same: it makes more sense that the vol space realigns with a drawdown and vol spike (VIX ~30). Conversely, we have to acknowledge that SPX could resume the grind, and single stock vols would come down to match the relatively lower index vol. We use the Risk Pivot to decide which way to lean, and that currently resides at 6,800 (we moved it to 6,800, from 6,900 on Friday).
©2025 TenTen Capital LLC DBA SpotGamma
All TenTen Capital LLC DBA SpotGamma materials, information, and presentations are for educational purposes only and should not be considered specific investment advice nor recommendations. Futures, foreign currency and options trading contains substantial risk and is not for every investor. An investor could potentially lose all or more than the initial investment. Risk capital is money that can be lost without jeopardizing one’s financial security or lifestyle. Only risk capital should be used for trading and only those with sufficient risk capital should consider trading. Past performance is not necessarily indicative of future results. VIEW FULL RISK DISCLOSURE https://spotgamma.com/model-faq/disclaimer/
|
| /ESH26 | SPX | SPY | NDX | QQQ | RUT | IWM |
|---|---|---|---|---|---|---|---|
| Reference Price: | $6923.88 | $6909 | $689 | $25012 | $608 | $2663 | $264 |
| SG Gamma Index™: |
| -0.167 | -0.287 |
|
|
|
|
| SG Implied 1-Day Move: |
| 0.63% | 0.63% |
|
|
|
|
| SG Implied 5-Day Move: |
| 1.47% |
|
|
|
|
|
| SG Implied 1-Day Move High: |
| After open | After open |
|
|
|
|
| SG Implied 1-Day Move Low: |
| After open | After open |
|
|
|
|
| SG Volatility Trigger™: | $6914.88 | $6900 | $690 | $24810 | $610 | $2660 | $263 |
| Absolute Gamma Strike: | $7014.88 | $7000 | $690 | $25075 | $600 | $2700 | $260 |
| Call Wall: | $7014.88 | $7000 | $700 | $25075 | $630 | $2700 | $270 |
| Put Wall: | $6814.88 | $6800 | $675 | $24000 | $600 | $2550 | $255 |
| Zero Gamma Level: | $6883.88 | $6869 | $688 | $24762 | $612 | $2657 | $270 |
| Key Support & Resistance Strikes |
|---|
| SPX Levels: [7000, 6900, 6000, 6800] |
| SPY Levels: [690, 685, 680, 675] |
| NDX Levels: [25075, 25000, 25200, 26000] |
| QQQ Levels: [600, 610, 620, 590] |
| SPX Combos: [(7248,89.72), (7227,73.88), (7200,96.08), (7193,71.51), (7172,69.29), (7158,91.34), (7151,92.71), (7124,75.20), (7103,97.85), (7075,85.18), (7068,77.75), (7062,81.97), (7048,96.74), (7041,76.58), (7034,68.16), (7027,95.72), (7020,89.55), (7013,97.11), (7006,72.97), (6999,98.02), (6992,88.55), (6986,80.05), (6979,84.86), (6972,93.93), (6965,88.05), (6958,92.03), (6951,91.48), (6944,73.40), (6937,77.97), (6923,79.15), (6910,70.13), (6889,74.53), (6882,72.17), (6875,71.65), (6868,88.54), (6847,94.98), (6834,74.29), (6827,91.63), (6813,88.88), (6799,98.07), (6792,88.42), (6785,67.75), (6778,84.53), (6764,88.91), (6758,87.04), (6751,89.57), (6737,72.43), (6730,66.41), (6723,90.75), (6716,74.62), (6702,97.26), (6688,72.08), (6675,75.90), (6668,75.70), (6661,71.97), (6647,90.30), (6626,74.35), (6612,82.01), (6599,94.87), (6578,81.16)] |
| SPY Combos: [678.35, 668.08, 708.47, 658.5] |
| NDX Combos: [24662, 24237, 25063, 23837] |
| QQQ Combos: [599.86, 590.2, 584.77, 579.94] |
|
| SPX | SPY | NDX | QQQ | RUT | IWM |
|---|---|---|---|---|---|---|
| Gamma Tilt: | 0.982 | 0.739 | 1.18 | 0.656 | 0.950 | 0.603 |
| Gamma Notional (MM): | $46.451M | ‑$517.494M | $4.938M | ‑$539.471M | ‑$2.61M | ‑$440.209M |
| 25 Delta Risk Reversal: | -0.074 | 0.00 | -0.089 | -0.08 | -0.067 | -0.068 |
| Call Volume: | 641.501K | 1.301M | 16.11K | 810.649K | 31.968K | 293.147K |
| Put Volume: | 990.047K | 2.325M | 10.873K | 1.289M | 53.678K | 786.091K |
| Call Open Interest: | 7.324M | 4.935M | 60.079K | 3.241M | 237.519K | 2.621M |
| Put Open Interest: | 11.789M | 9.552M | 86.406K | 5.463M | 405.646K | 6.475M |
0 comentarios