Macro Theme:
Key dates ahead:
- 1/5: ISM PMI
- 1/7: ISM/JOLTS
- 1/9: NFP
SG Summary:
Update 1/2: SPX is below our Risk Pivot at 6,890, and we see SPX IV’s being anchored higher into the start of ’26. Given that we have a neutral to short-leaning stance as non-0DTE gamma is negative own into 6,600, and higher SPX IV’s could also work to pressure SPX lower. A close back >6,900 into the week of 1/5 would remove the short bias.
12/26: The Risk Pivot is now 6,900. As the bullish OPEXMas closes today, we also shift to a generally more neutral stance vs bullish. IVs are now at lows, suggesting vanna as a fuel for higher stocks is gone. If SPX trades <6,890 we’d look to shift from a neutral to bearish stance. We will maintain some cheap call spreads and or call flies into the 7k strike for expirations into 12/31, based on the JPM Call.
Key SG levels for the SPX are:
- Resistance: 6,900, 6,920, 6,950
- Pivot: 6,890 (bearish <, bullish >) UPDATED 12/26
- Support: 6,850, 6,800
Founder’s Note:
Futures are up 50bps. No major data is on tap for today.
Support is at 6,850 & 6,800. Resistance is at 6,900.
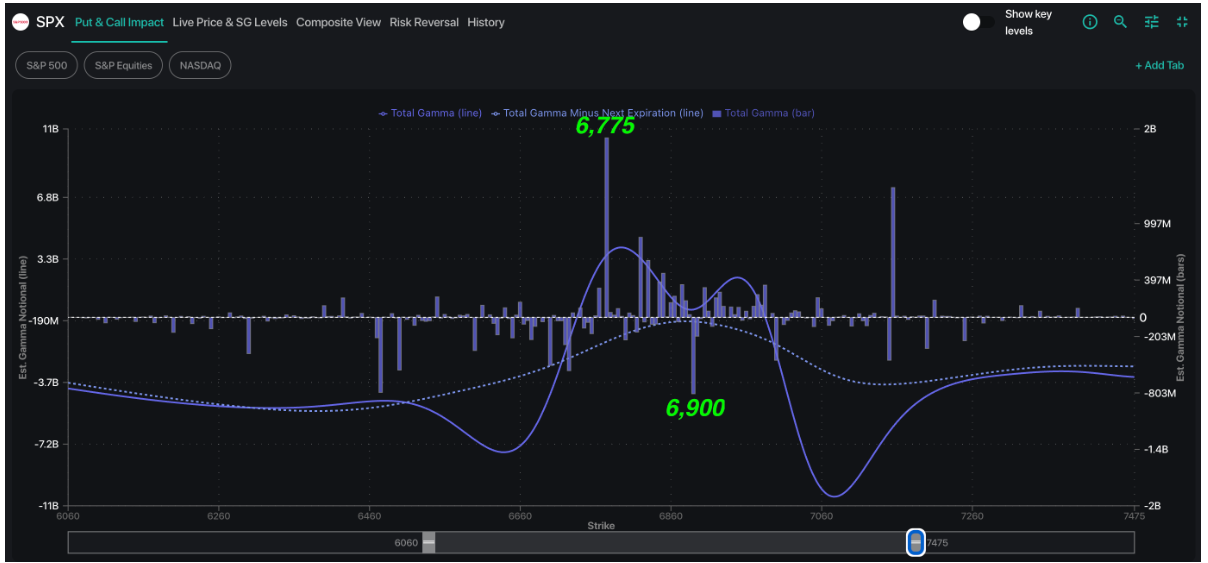
0DTE is supplying positive gamma for today, as seen in the SPX GEX chart. The solid line is all-exp GEX, with dashed line the GEX – 0DTE, negative across the board. This dynamic is not different from recent days, and suggests that whatever stability may be present today may not be present Monday. Additionally today is the last holiday-ish session, which suggests that the light vol premium built up on Wednesday is likely sold before the final holiday weekend.
We also discussed on Wednesday how SPX IV is going to lose suppression into next week, as seen by forward IV (light teal) being higher than live SPX IV (teal). This implies that SPX IVs are anchored to higher relative levels into next weeks cyclical macro data points (ISM, JOLTS, etc).
Finally, we see that there is an interesting rotation in single stock IVs. Into XMAS it was tech catching a call-bid, but that call bid has subsided and its now “DOW”/retail names that are bid. HD, DE, COST, WMT, TGT, etc. We’re unsure if this is some type of year end/tax loss related bid, or if there is something more material happening. Regardless these call skews are elevated, and its something positive for bulls if traders start to build up call positions in non tech names (it speaks to broadening breadth).
©2025 TenTen Capital LLC DBA SpotGamma
All TenTen Capital LLC DBA SpotGamma materials, information, and presentations are for educational purposes only and should not be considered specific investment advice nor recommendations. Futures, foreign currency and options trading contains substantial risk and is not for every investor. An investor could potentially lose all or more than the initial investment. Risk capital is money that can be lost without jeopardizing one’s financial security or lifestyle. Only risk capital should be used for trading and only those with sufficient risk capital should consider trading. Past performance is not necessarily indicative of future results. VIEW FULL RISK DISCLOSURE https://spotgamma.com/model-faq/disclaimer/
|
|
/ESH26 |
SPX |
SPY |
NDX |
QQQ |
RUT |
IWM |
|---|---|---|---|---|---|---|---|
|
Reference Price: |
$6891.4 |
$6845 |
$681 |
$25249 |
$614 |
$2481 |
$246 |
|
SG Gamma Index™: |
|
-0.669 |
-0.207 |
|
|
|
|
|
SG Implied 1-Day Move: |
|
0.61% |
0.61% |
|
|
|
|
|
SG Implied 5-Day Move: |
|
1.48% |
|
|
|
|
|
|
SG Implied 1-Day Move High: |
|
After open |
After open |
|
|
|
|
|
SG Implied 1-Day Move Low: |
|
After open |
After open |
|
|
|
|
|
SG Volatility Trigger™: |
$6921.4 |
$6875 |
$684 |
$25240 |
$616 |
$2500 |
$250 |
|
Absolute Gamma Strike: |
$7046.4 |
$7000 |
$685 |
$25250 |
$615 |
$2500 |
$245 |
|
Call Wall: |
$7046.4 |
$7000 |
$687 |
$25250 |
$630 |
$2530 |
$260 |
|
Put Wall: |
$6846.4 |
$6800 |
$680 |
$24000 |
$615 |
$2490 |
$245 |
|
Zero Gamma Level: |
$6903.4 |
$6857 |
$680 |
$24996 |
$617 |
$2532 |
$251 |
|
Key Support & Resistance Strikes |
|---|
|
SPX Levels: [7000, 6900, 6850, 6800] |
|
SPY Levels: [685, 680, 684, 690] |
|
NDX Levels: [25250, 25500, 25600, 25000] |
|
QQQ Levels: [615, 620, 610, 600] |
|
SPX Combos: [(7154,85.79), (7147,88.02), (7126,77.79), (7099,96.57), (7078,79.72), (7051,94.51), (7030,78.94), (7023,72.94), (7017,71.79), (7003,98.36), (6982,82.92), (6976,90.74), (6969,67.18), (6962,73.14), (6955,82.20), (6948,94.82), (6941,69.90), (6934,68.94), (6928,94.80), (6921,76.00), (6907,87.26), (6900,95.99), (6893,71.17), (6873,89.84), (6866,88.75), (6859,70.70), (6852,94.88), (6846,85.50), (6839,88.30), (6832,89.93), (6825,95.62), (6818,79.22), (6811,75.14), (6798,97.78), (6791,67.25), (6784,68.62), (6777,96.31), (6770,71.08), (6763,83.08), (6750,95.44), (6743,76.32), (6729,83.68), (6722,87.11), (6702,95.16), (6688,67.07), (6674,80.18), (6647,87.60), (6626,80.55), (6599,90.45), (6551,68.67), (6524,78.06), (6517,73.08)] |
|
SPY Combos: [697.24, 692.44, 689.69, 694.5] |
|
NDX Combos: [25275, 25073, 25250, 24669] |
|
QQQ Combos: [615.08, 610.13, 614.46, 624.99] |
|
|
SPX |
SPY |
NDX |
QQQ |
RUT |
IWM |
|---|---|---|---|---|---|---|
|
Gamma Tilt: |
0.924 |
0.827 |
1.18 |
0.682 |
0.408 |
0.475 |
|
Gamma Notional (MM): |
‑$367.771M |
‑$801.737M |
$2.335M |
‑$798.636M |
‑$97.095M |
‑$850.502M |
|
25 Delta Risk Reversal: |
-0.04 |
-0.022 |
-0.05 |
-0.034 |
-0.029 |
-0.013 |
|
Call Volume: |
564.015K |
1.287M |
15.767K |
850.052K |
15.136K |
228.574K |
|
Put Volume: |
895.993K |
1.625M |
17.915K |
1.013M |
33.113K |
417.209K |
|
Call Open Interest: |
6.62M |
4.859M |
56.823K |
3.455M |
189.989K |
2.715M |
|
Put Open Interest: |
11.277M |
9.156M |
79.213K |
5.246M |
350.508K |
5.892M |

0 comentarios