
Macro Theme:
Short Term SPX Resistance: 5,050
Short Term SPX Support: 5,000
SPX Risk Pivot Level: 4,900
Major SPX Range High/Resistance: 5,100
Major SPX Range Low/Support: 4,800
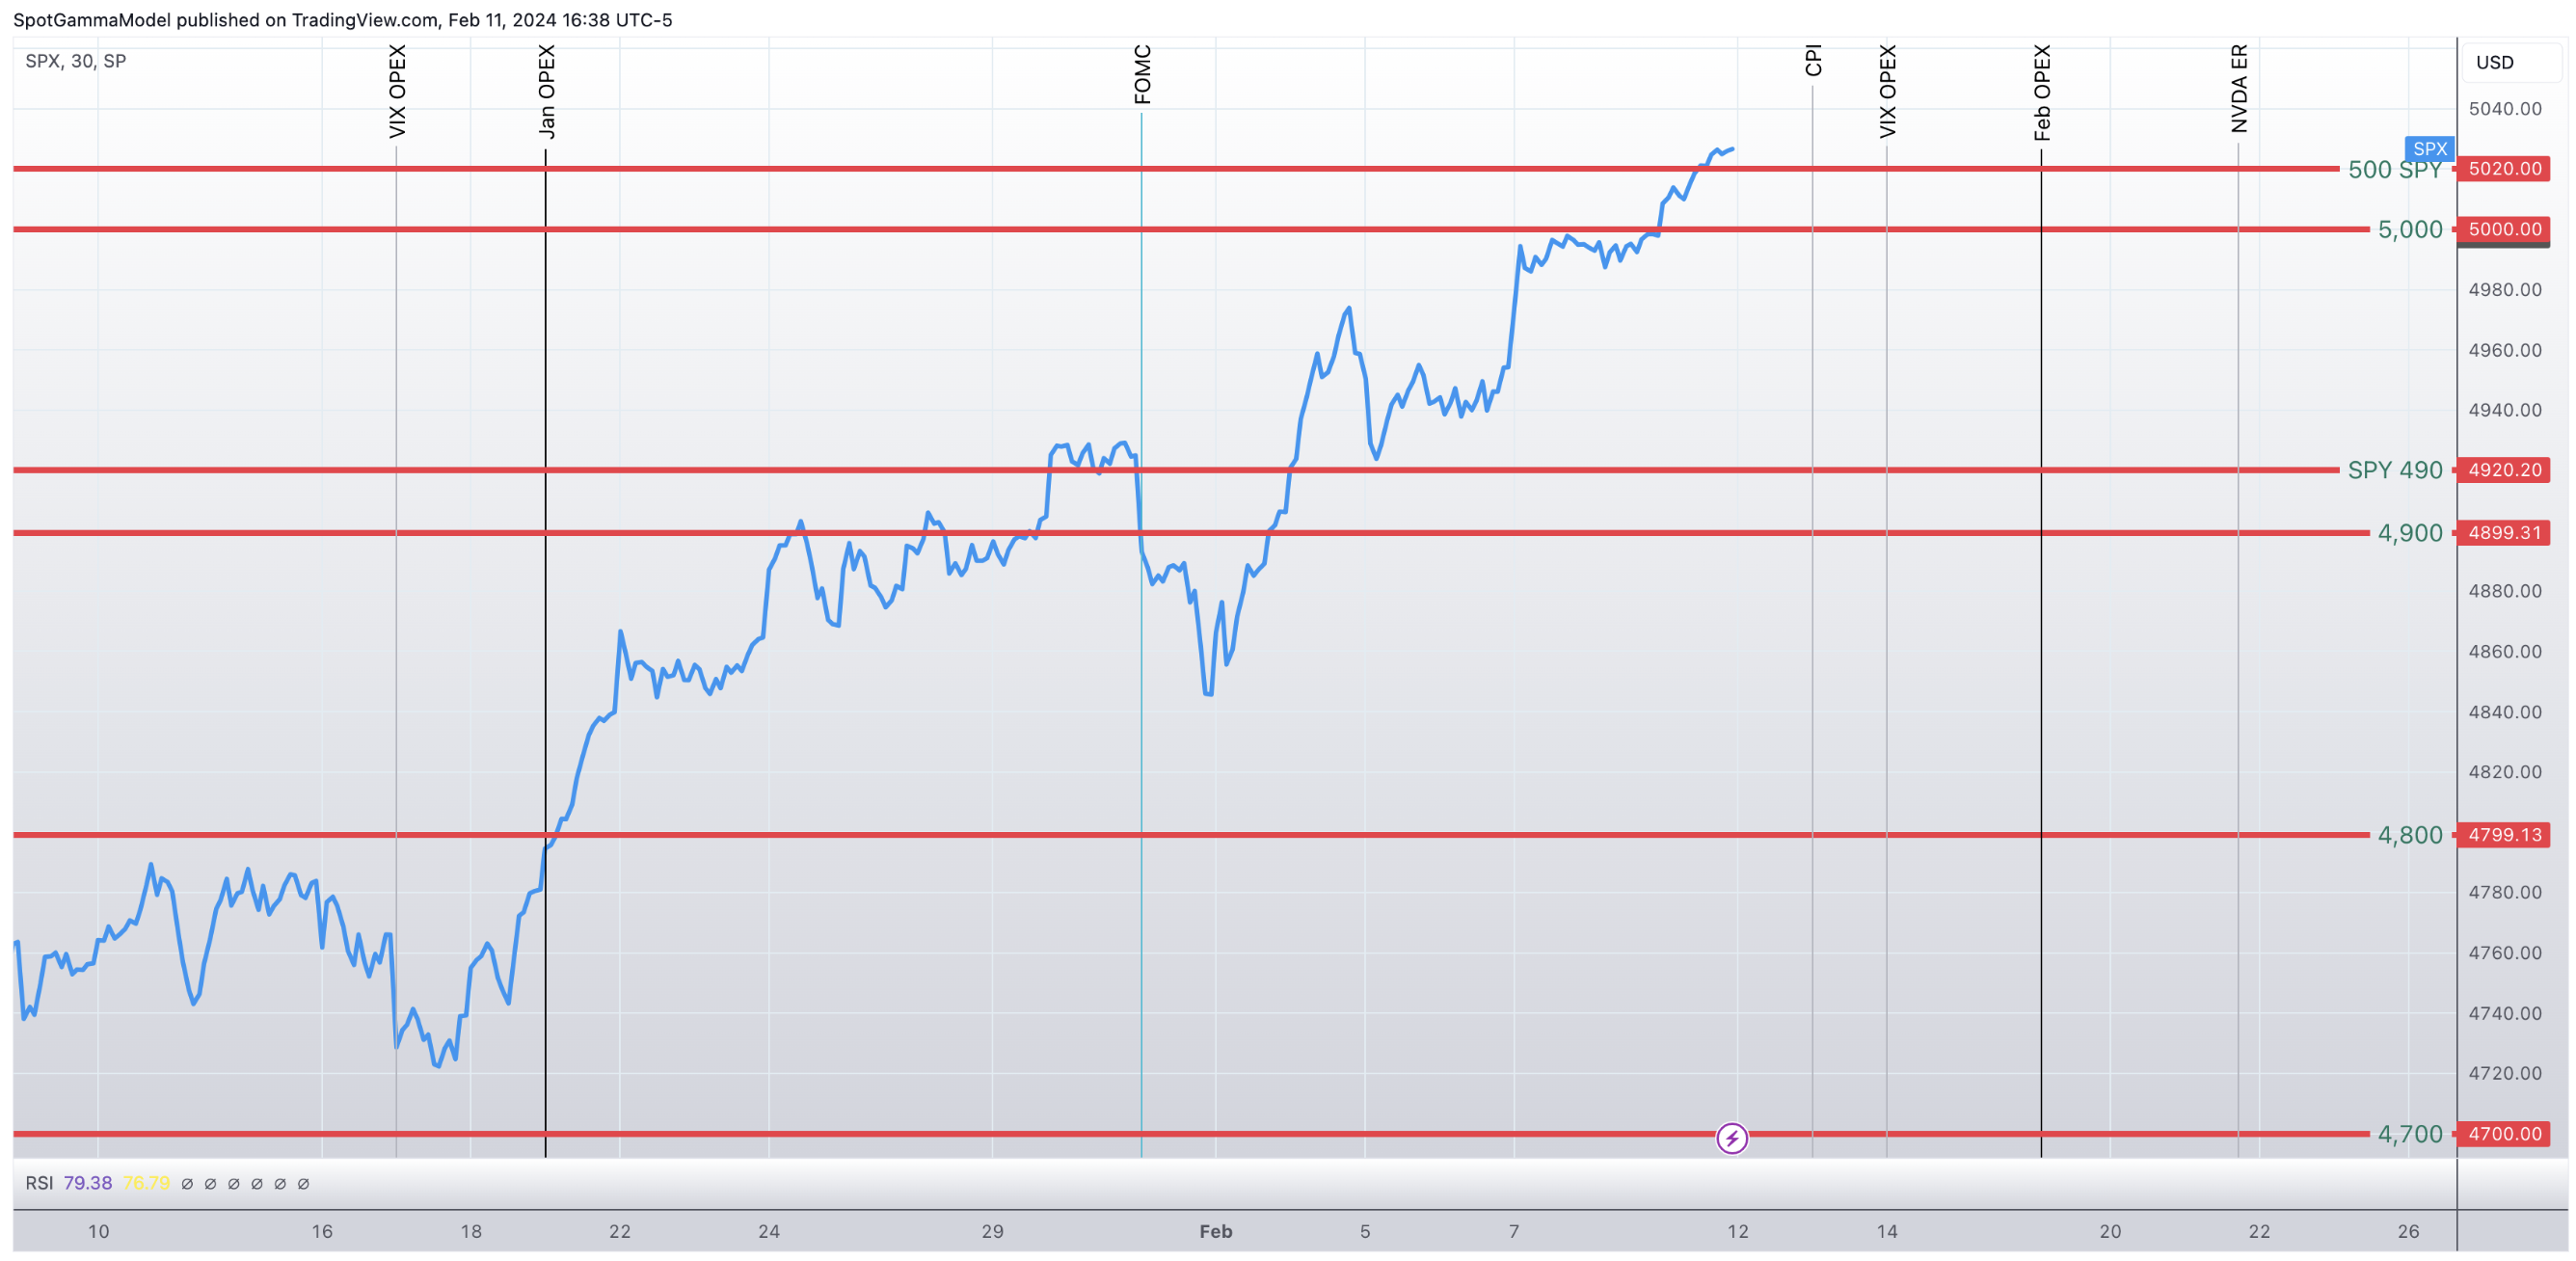
‣ Volatility should continue to contract into 2/14 VIX expiration – 2/16 equity expiration. Major downside “risk-off” occurs on a break of 4,900, which is our first major support. 5,000 – 5,015 (SPY 500) is major resistance.*
*updated 2/9. Our view above, from 2/7, was updated to account for the huge gamma size at SPY 500 (SPX 5,015 equivalent).
Founder’s Note:
ES Futures are flat to 5,045. NQ futures are up 25 bps to 18,047.
Key SG levels for the SPX are:
- Support: 5,020, 5,000 4,968
- Resistance: 5,023, 5050
- 1 Day Implied Range: 0.58%
For QQQ:
- Support: 433, 430
- Resistance: 440
Call Wall
IWM:
- Support: 196, 190
- Resistance: 200
Call Wall
S&P500
Call Walls
have again rolled higher: 504 SPY & 5,100 SPX. With this, we note 5,050 as major resistance for today, with 5,000-5,015 support. Today’s SG 1-Day implied move is just 58bps, which is about as narrow as our ranges get.
Call Walls
remain at QQQ 440 and IWM 200.
The current dynamics are very clear: heavy single stock call buying, combined with volatility/put selling, is leading to an upside chase in equities. This results in a negative gamma position across single stocks, which creates a reflexive feedback loop wherein not only do dealers have to buy equities as they move higher, but the FOMO/chase behavior is emboldened into higher equity prices. The knock-on effect of this is a crushing of downside hedging demand, leaving index vol “priced for perfection”. We see this priced in todays 6.25% ATM 0DTE IV – this is about as low as SPX IV’s can go.
While we do not anticipate the S&P moving away from the big 5,000-5,020 (SPY 500) zone today, our major focus is shifting to Tuesday’s CPI, Wednesday’s VIX EXP, and Friday’s OPEX. Following that is the NVDA ER on 2/21, which is the leader of the euphoric semi-sector. Any shift or snap in the momentum could likely cause a quick slide lower, which we’d frame as a basic correction as long as the SPX holds 4,900. This would be driven by the removal of call positions and/or a decline in call skews, which would likely draw dealer selling.
Backing some of our statements from above is exhibit A, from the OCC is single stock buying premium, which ramped higher last week (red arrow). As you can see, this is the most bullish flow we’ve seen early 2022.
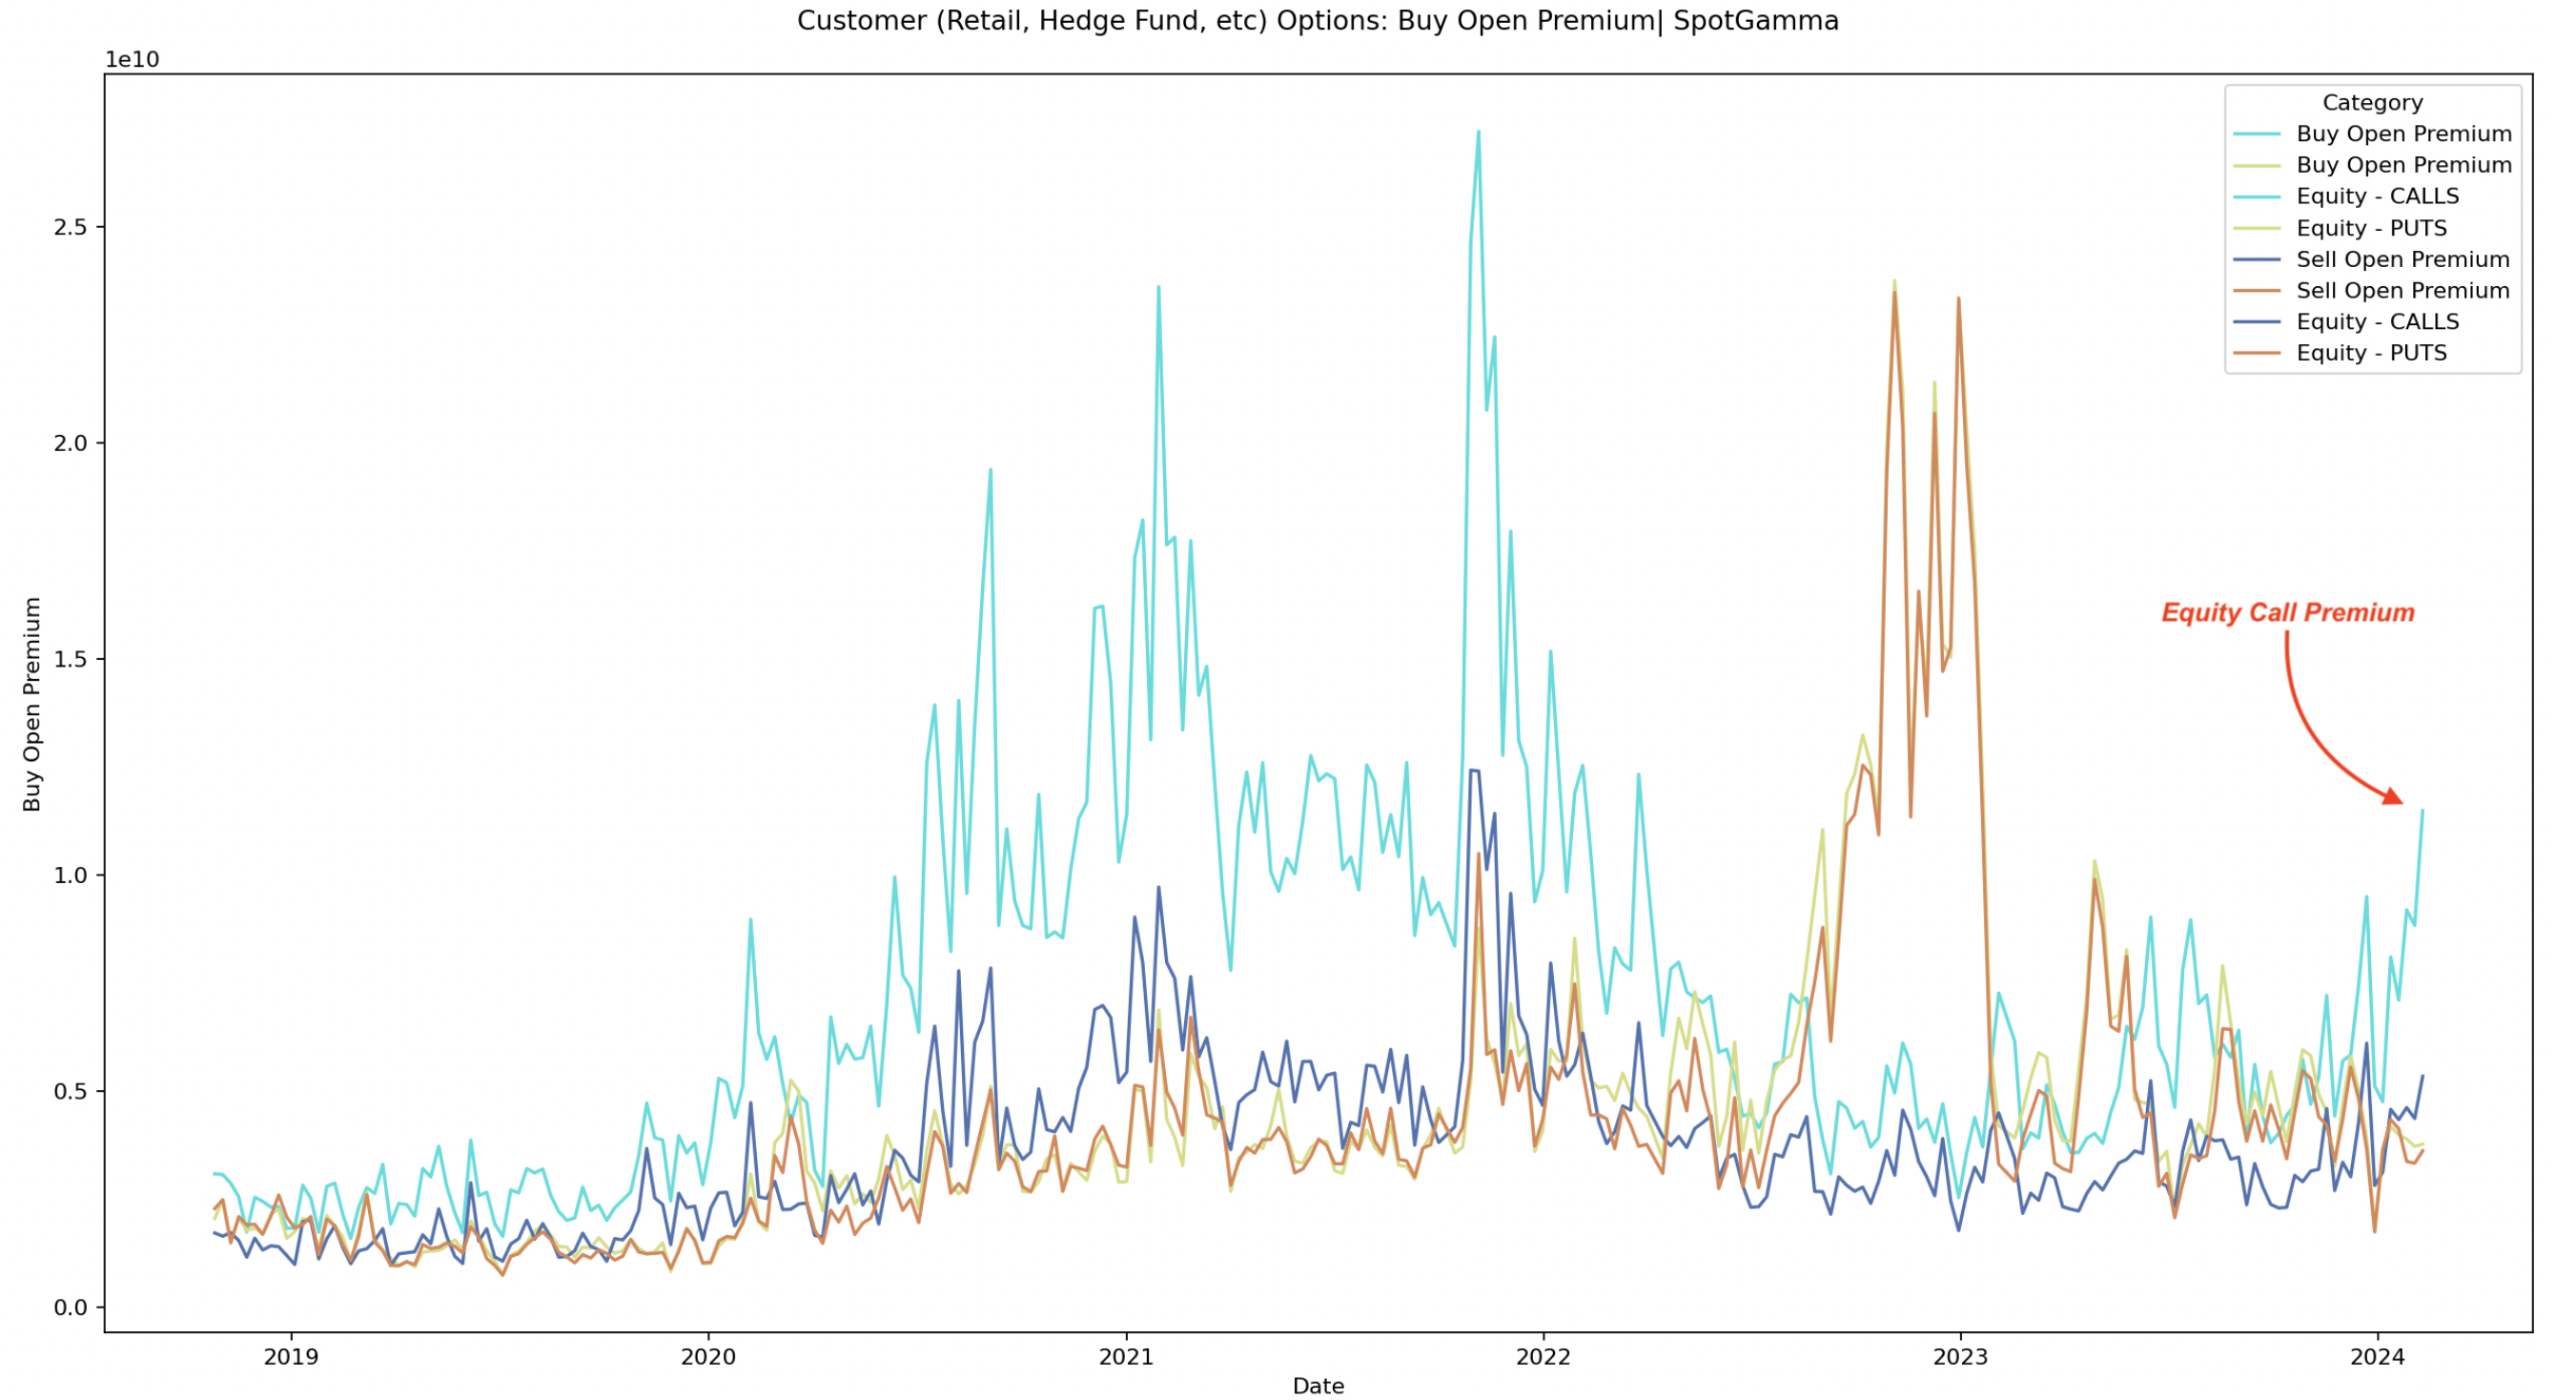
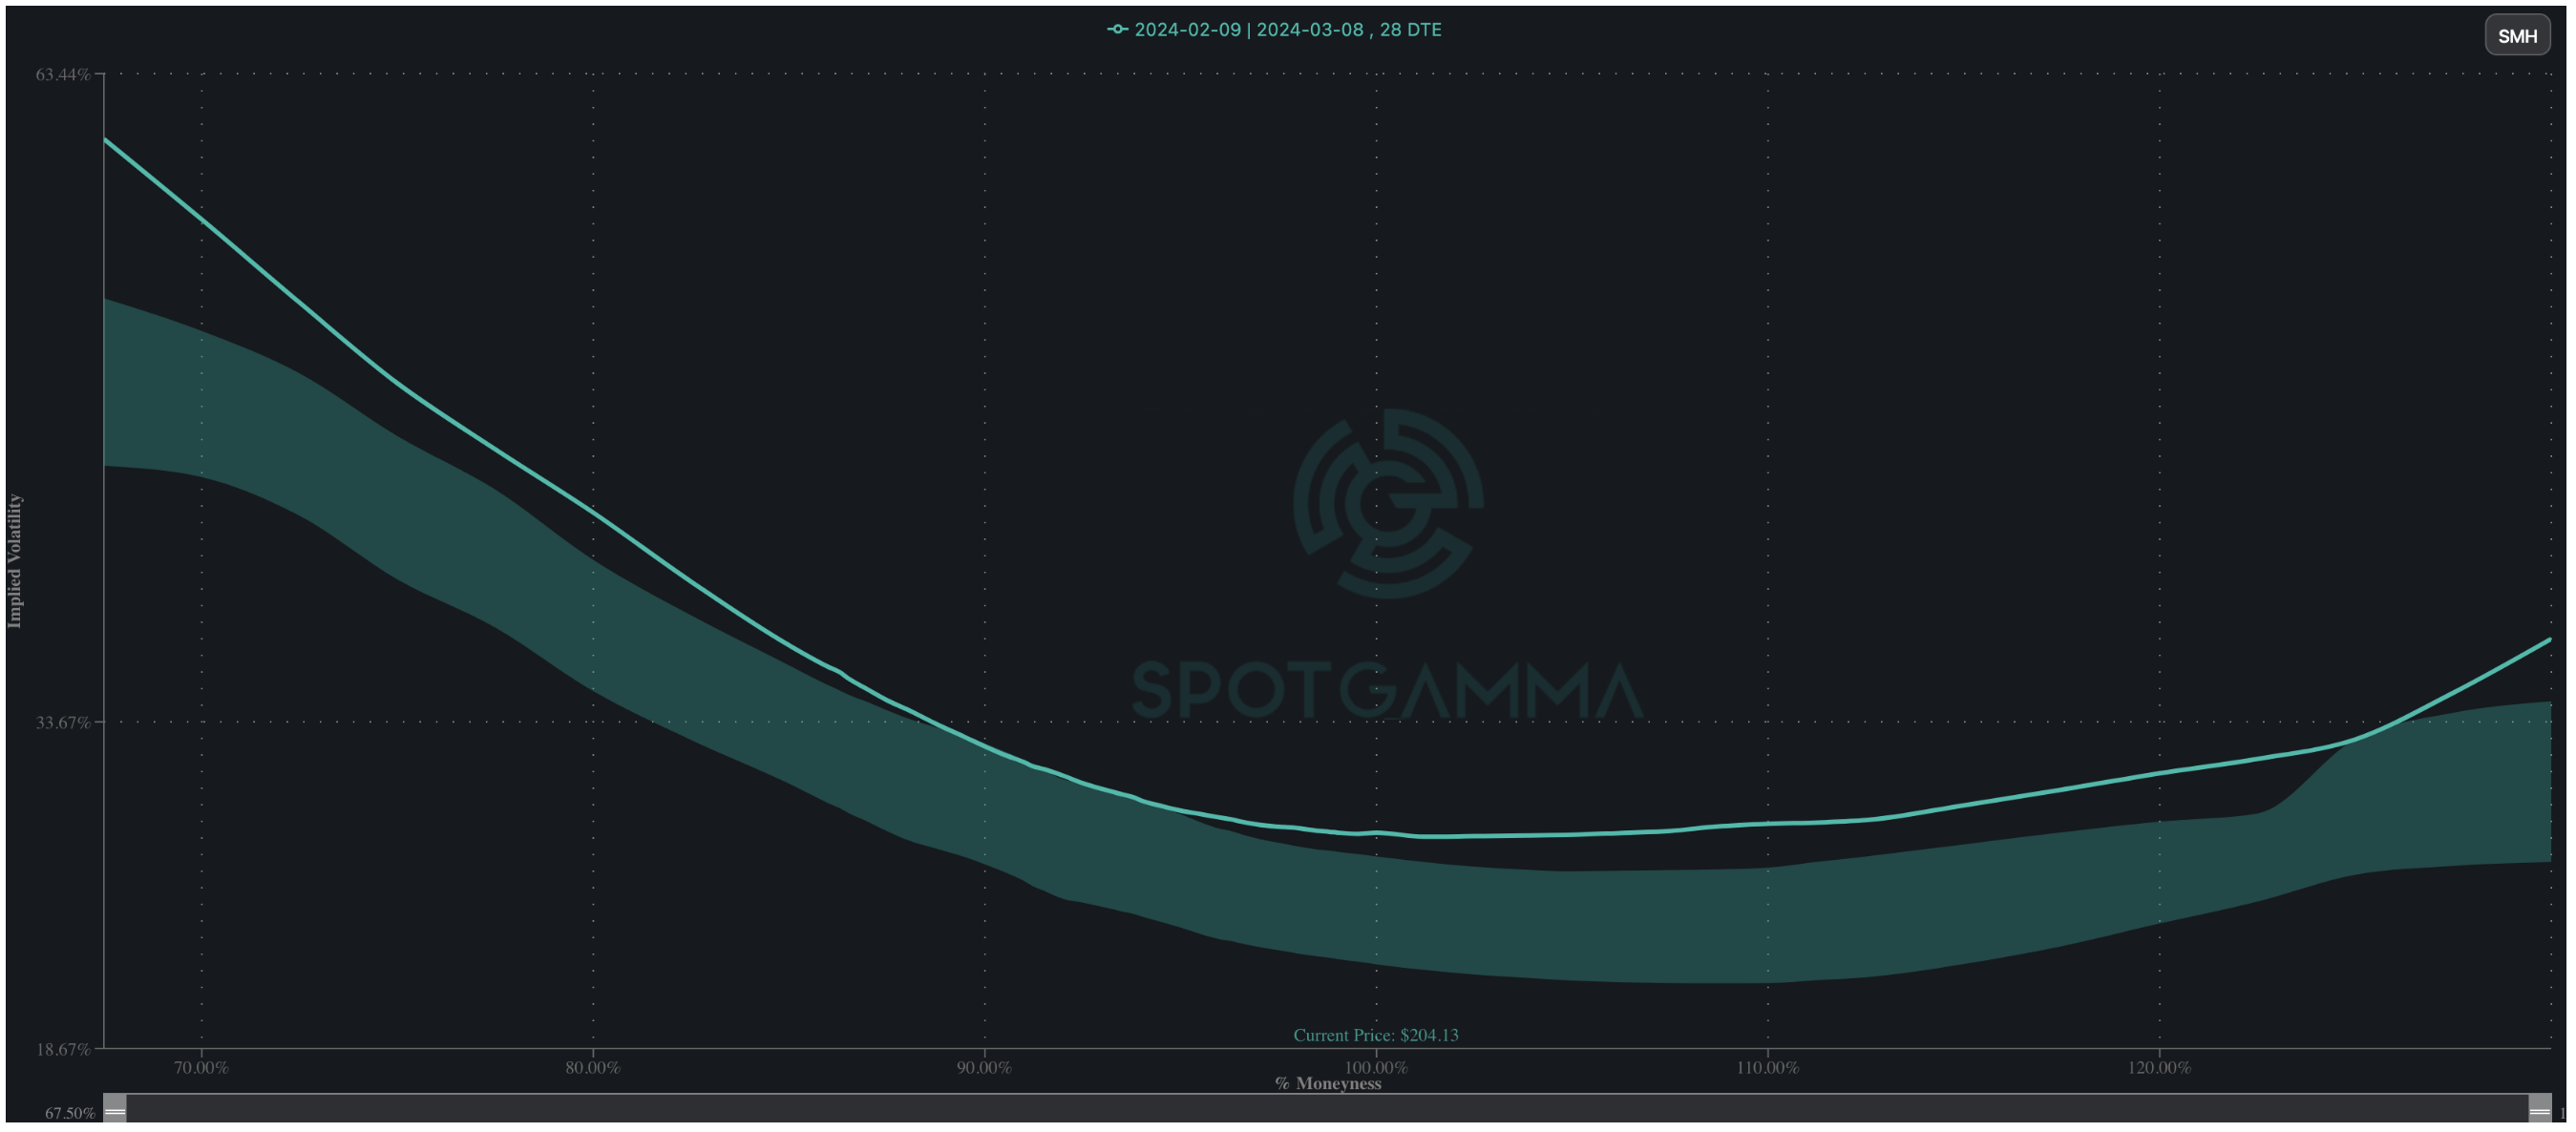
Chart B is SMH 1 month skew. Note how elevated the upside strikes are relative to recent history (shaded cone). Further, in line with Friday’s note, our skew ranks are flagging 1 year highs in call vs put IV’s Mag 7’s, major SEMI/AI names, SOXL, QQQ, TQQQ, SMH, even ARKK. High call skews back the idea of heavy bullish call demand, however in this case, its showing signs of being extreme.
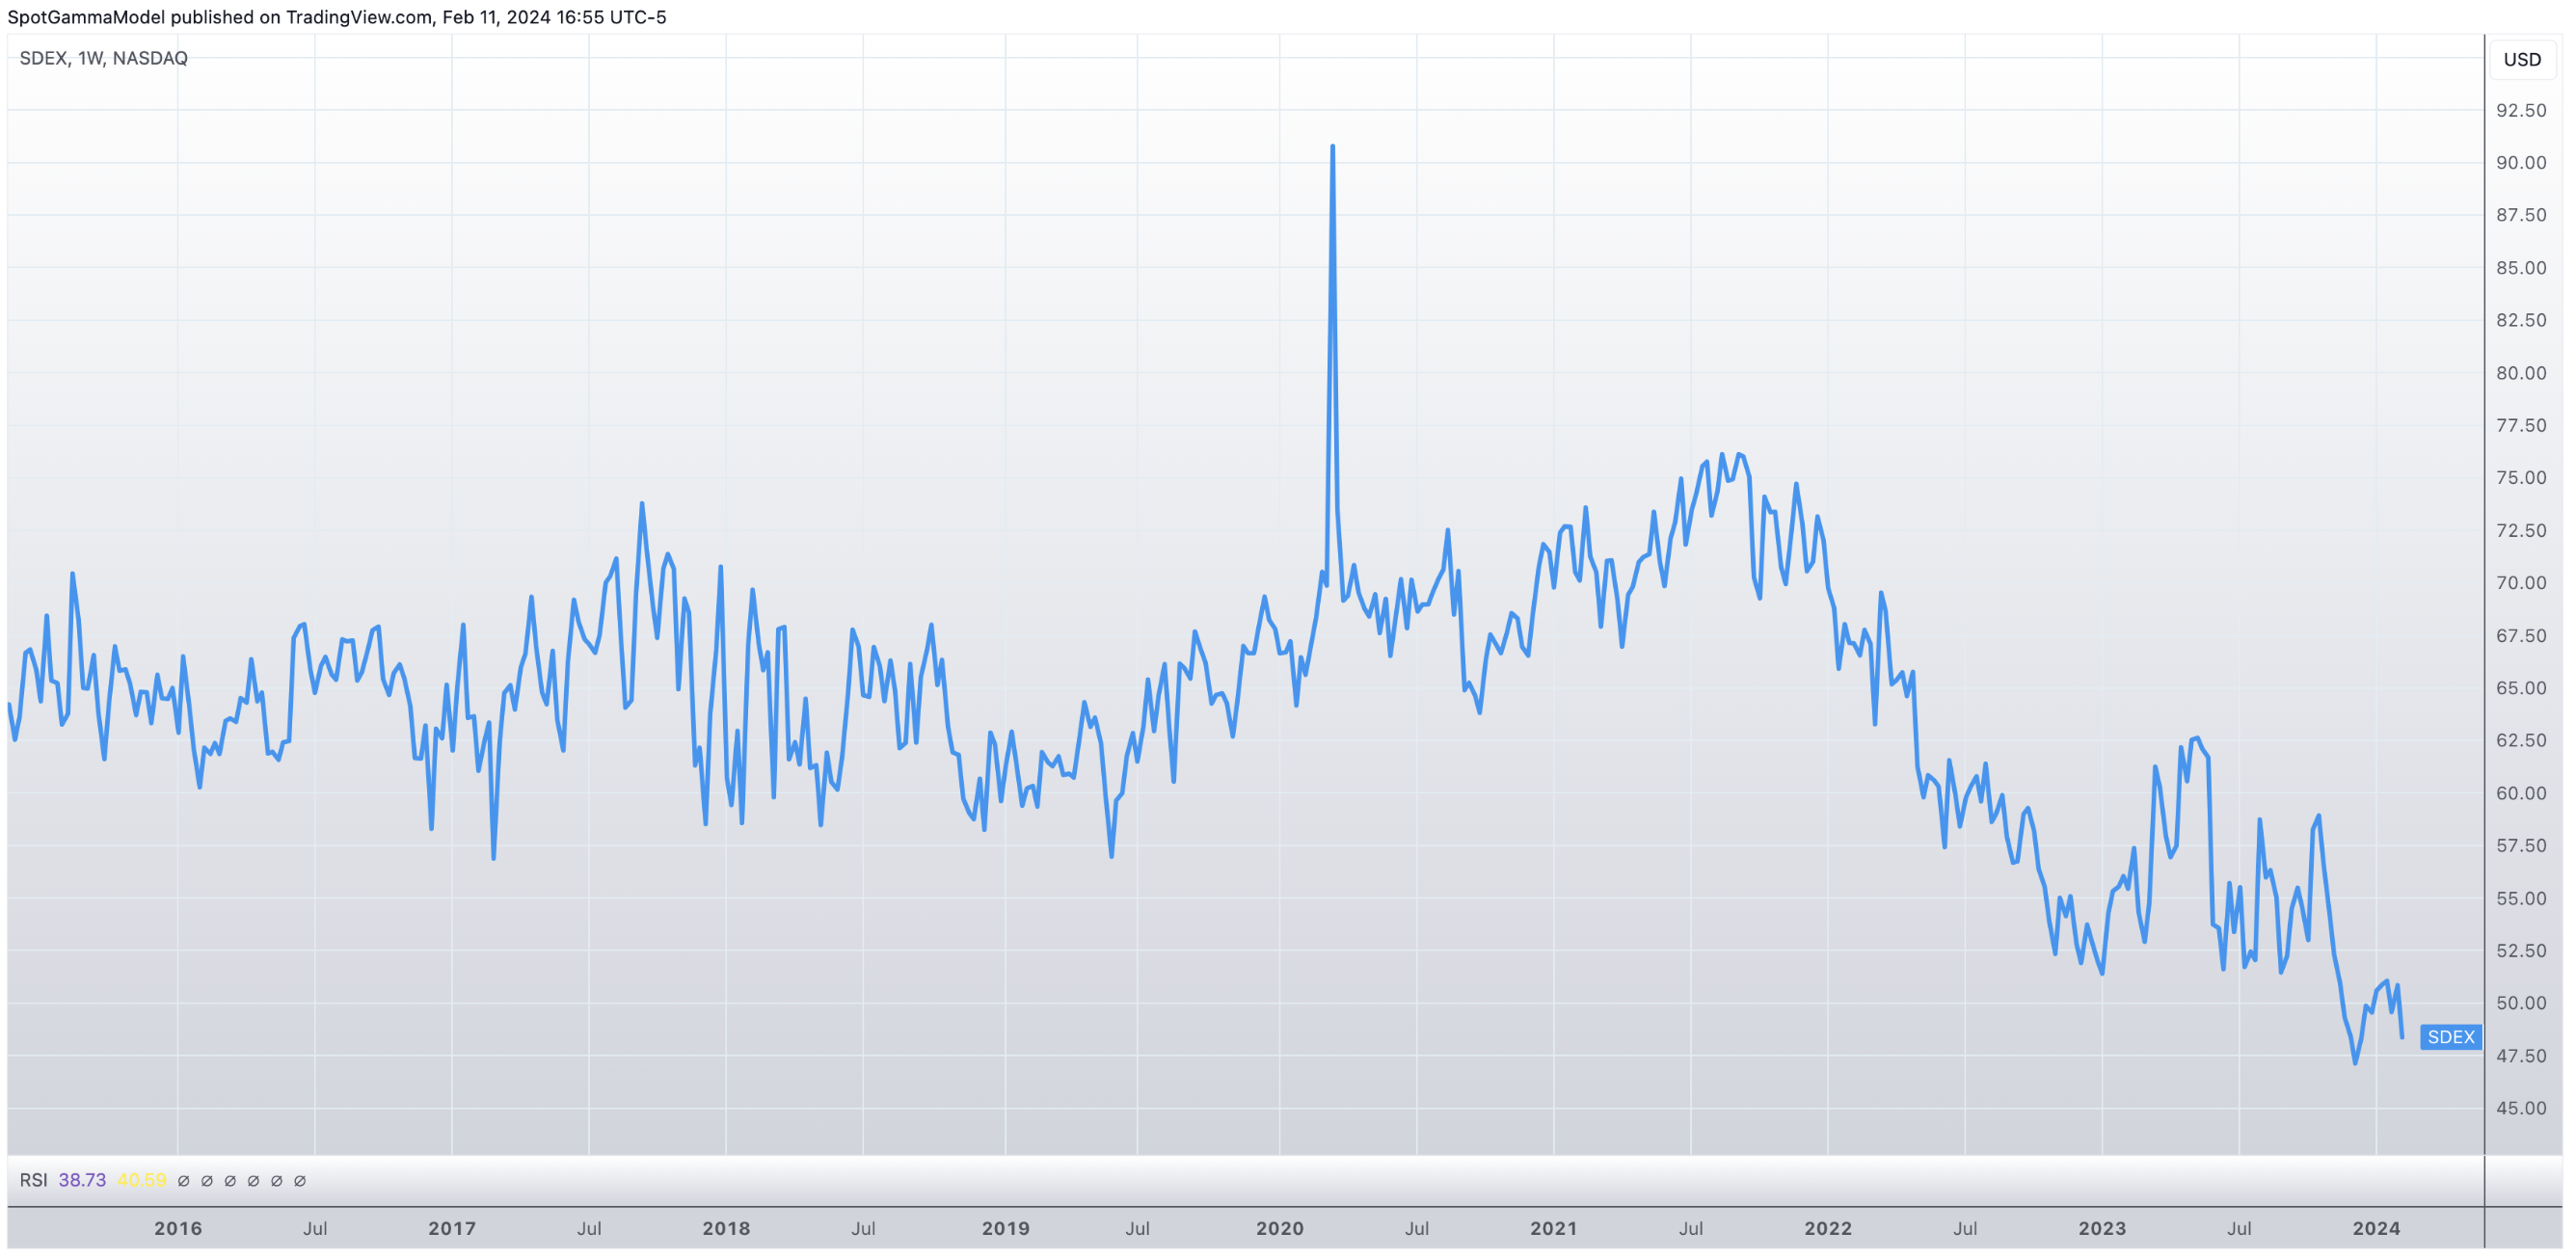
Finally, we present the SDEX which measures 1-month, 1 standard-deviation SPY put IV vs ATM SPY IV – essentially the cost to hedge a small equity move lower. Those are sub-basement levels, which suggest that even a mild downside move could draw some outsized downside demand simply on the basis of short vol positions needing to cover juiced positions.
We stress that we are not attempting to call a significant market high, we’re more operating from the base case that some consolidation is likely due. Again, the window for change opens up this week, starting with tomorrow’s CPI, then VIX Exp & OPEX.
| SpotGamma Proprietary Levels | SPX | SPY | NDX | QQQ | RUT | IWM |
|---|---|---|---|---|---|---|
| Reference Price: | $5026 | $501 | $17962 | $437 | $2009 | $199 |
| SpotGamma Implied 1-Day Move: | 0.58% | 0.58% |
|
|
|
|
| SpotGamma Implied 5-Day Move: | 1.83% |
|
|
|
|
|
| SpotGamma Volatility Trigger™: | $4945 | $499 | $17290 | $433 | $1900 | $196 |
| Absolute Gamma Strike: | $5000 | $500 | $18000 | $440 | $2000 | $200 |
| SpotGamma Call Wall: | $5100 | $504 | $18000 | $440 | $2100 | $200 |
| SpotGamma Put Wall: | $4500 | $490 | $16000 | $415 | $1800 | $190 |
| Additional Key Levels | SPX | SPY | NDX | QQQ | RUT | IWM |
|---|---|---|---|---|---|---|
| Zero Gamma Level: | $4960 | $496 | $16617 | $429 | $1990 | $197 |
| Gamma Tilt: | 1.35 | 1.212 | 1.774 | 1.368 | 1.065 | 1.116 |
| SpotGamma Gamma Index™: | 2.011 | 0.185 | 0.078 | 0.124 | 0.005 | 0.019 |
| Gamma Notional (MM): | $743.794M | $687.688M | $7.556M | $503.288M | $5.799M | $176.942M |
| 25 Delta Risk Reversal: | -0.027 | -0.021 | -0.028 | -0.016 | 0.000 | 0.001 |
| Call Volume: | 650.569K | 1.846M | 10.483K | 906.011K | 36.984K | 709.937K |
| Put Volume: | 1.223M | 2.405M | 13.665K | 1.195M | 55.931K | 733.079K |
| Call Open Interest: | 6.602M | 6.491M | 56.605K | 4.263M | 254.717K | 4.495M |
| Put Open Interest: | 13.598M | 15.453M | 74.885K | 8.222M | 455.814K | 8.219M |
| Key Support & Resistance Strikes |
|---|
| SPX Levels: [5000, 4900, 4950, 4800] |
| SPY Levels: [500, 495, 501, 502] |
| NDX Levels: [18000, 17600, 17625, 17850] |
| QQQ Levels: [440, 430, 434, 437] |
| SPX Combos: [(5248,86.95), (5198,98.41), (5177,81.00), (5152,95.89), (5127,91.58), (5122,77.98), (5117,88.02), (5102,99.70), (5082,94.08), (5077,97.54), (5072,84.03), (5067,90.30), (5062,85.42), (5057,93.63), (5052,99.61), (5047,91.97), (5042,91.60), (5037,90.24), (5032,82.13), (5027,95.83), (5017,97.35), (5001,99.32), (4996,72.23), (4976,83.95), (4951,91.55), (4851,81.31), (4800,76.37)] |
| SPY Combos: [502.57, 506.08, 503.58, 501.57] |
| NDX Combos: [18088, 17998, 18034, 18501] |
| QQQ Combos: [444.96, 439.71, 420.89, 438.83] |
SPX Gamma Model
$4,047$4,547$5,047$6,032Strike-$1.7B-$940M-$190M$1.2BGamma NotionalPut Wall: 4500Call Wall: 5100Abs Gamma: 5000Vol Trigger: 4945Last Price: 5026
Strike: $5,388
- Next Expiration: $542,675,433
- Current: $544,075,182
View All Indices Charts
0 comentarios