Macro Theme:
Short Term SPX Resistance: 5,200
Short Term SPX Support: 5,100
SPX Risk Pivot Level: 5,100
Major SPX Range High/Resistance: 5,200 SPX Call Wall
Major SPX Range Low/Support: 4,800
‣ 5,200 is the upside target.*
‣ 5,100 is critical support, up from 5,000 the week ending 3/1.*
‣ We look for index volatility to now contract (ref: 2/23, 1-month realized vol 14%, VIX 14.2).
‣ The week of 3/11 is the next major inflection point: 3/12 CPI & March Quarterly OPEX (3/15), followed by 3/20 VIX exp *
*updated 3/4
Founder’s Note:
ES futures are flat at 5,160. NQ futures are flat at 18,300.
Key SG levels for the SPX are:
- Support: 5,150, 5,115 (SPY 510), 5,100
- Resistance: 5,160 (SPY 515
Call Wall
), 5,178, 5,188, 5,200 (SPX
Call Wall
)
- 1 Day Implied Range: 0.59%
For QQQ:
- Support: 445, 442
- Resistance: 450
Call Wall
IWM:
- Support: 204, 200, 198
- Resistance: 210
Call Wall
Non Farms is out today at 8:30AM ET.
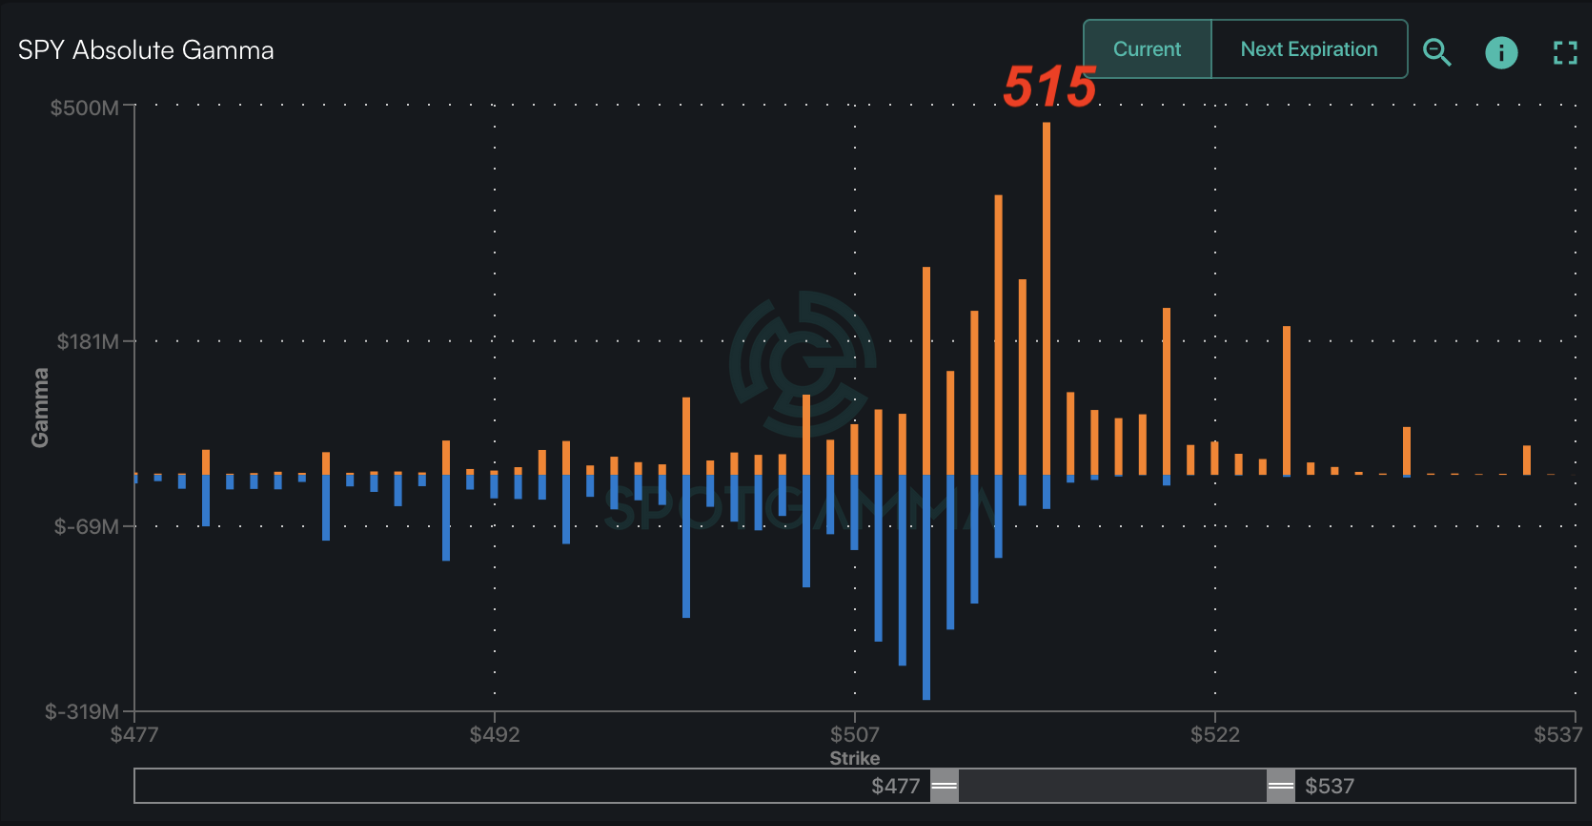
TLDR: Today’s major levels are 5,200 to the upside, and 5,100 to the downside. SPY 515 (shown below) is also critical as it remains a huge gamma strike – the largest of any S&P500 strike (SPX or SPY). Our 1-day implied move widened out to 59 bps (from 50bps, yesterday), and we note the 0DTE straddle is $34/65bps today due to NFP (vs 50bps yesterday).

Yesterday’s rally, which felt extremely strong, had an intraday range of just 47bps and rejected at the large SPY 515 strike. On a close to close basis, the SPX was +1%, but nearly all of those gains came from pre-market until ~11AM ET, after which point there was mainly drift in the 5,150-5,160 (SPY 515) range. Recall that yesterday’s SG 1-day implied move for SPX was a tight 50bps. The intraday range holding to that range suggests that despite that larger premarket action, the S&P is still holding to these big gamma levels. This is not to take away from the fresh close at all time highs, but to imply that there is still some order to things.
What also struck us, was that nearly all of the S&P500
HIRO
signal from yesterday was driven by 0DTE flow. You can also see the shortest dated options impact in the Mag7
HIRO
signal (which combines the
HIRO
signal across the Magnificent 7), shown below. The main drivers of the Mag7 options flow were NVDA & META, but was is interesting is that there was a large amount of short dated positive delta order flow (teal line) from the open until ~10:45AM (red box). This coincided with the largest window of gains in equities yesterday (i.e. before 11AM). Yes, the “all expiration order flow signal” (purple) continued higher after 11AM, but it was a more modest $1bn over the rest of the day vs $1bn in the first hour. To put this all into context, the largest Mag7 positive
HIRO
signal over 1 day is ~$4bn.
The point here is that we think when 0DTE order flow is a large (or main) driver, its a sign that trading is on momentum and the associated move is more prone to reversal. Therefore bullish followthrough from yesterday isn’t “in the bag”. Also note that the SPY
Call Wall
remains at 515, and the fact that it did not roll higher suggests a lack of call activity overhead.
On this point, AVGO & MRVL, leading semi-stocks, are -2% & -5% after reporting earnings last night. One could imagine that if those were higher it would add to the semi-stock momentum trade. Therefore today’s AM driver is the 8:30AM NFP number, which, if its benign, could provide an equity pop as the related event-vol comes off. Based on that NFP number we could easily see drift back towards 5,100, or a shift up toward 5,200.

We remain of the view that the bull trade here could be losing momentum, and the target area for that to really take shape is next week, into 3/12 CPI, 3/15 OPEX. This gives way into a heavily anticipated 3/18 NVDA event, and 3/20 VIX Exp.
| SpotGamma Proprietary Levels | SPX | SPY | NDX | QQQ | RUT | IWM |
|---|---|---|---|---|---|---|
| Reference Price: | $5157 | $514 | $18297 | $445 | $2084 | $206 |
| SpotGamma Implied 1-Day Move: | 0.59% | 0.59% |
|
|
|
|
| SpotGamma Implied 5-Day Move: | 2.02% |
|
|
|
|
|
| SpotGamma Volatility Trigger™: | $5095 | $511 | $17740 | $442 | $2010 | $204 |
| Absolute Gamma Strike: | $5000 | $515 | $18000 | $440 | $2050 | $210 |
| SpotGamma Call Wall: | $5200 | $515 | $17750 | $450 | $2050 | $210 |
| SpotGamma Put Wall: | $4800 | $490 | $17600 | $425 | $1950 | $198 |
| Additional Key Levels | SPX | SPY | NDX | QQQ | RUT | IWM |
|---|---|---|---|---|---|---|
| Zero Gamma Level: | $5089 | $513 | $17445 | $441 | $2064 | $203 |
| Gamma Tilt: | 1.415 | 1.155 | 1.488 | 1.201 | 1.116 | 1.307 |
| SpotGamma Gamma Index™: | 2.288 | 0.139 | 0.063 | 0.081 | 0.011 | 0.047 |
| Gamma Notional (MM): | $330.296M | $187.526M | $2.894M | $172.66M | $5.382M | $412.215M |
| 25 Delta Risk Reversal: | -0.028 | -0.021 | -0.017 | -0.035 | -0.012 | -0.013 |
| Call Volume: | 637.185K | 1.913M | 9.575K | 787.388K | 16.593K | 465.10K |
| Put Volume: | 1.038M | 2.329M | 12.395K | 1.432M | 28.208K | 644.908K |
| Call Open Interest: | 7.173M | 6.622M | 41.586K | 3.587M | 277.293K | 4.776M |
| Put Open Interest: | 14.567M | 16.674M | 74.446K | 8.734M | 510.881K | 8.56M |
| Key Support & Resistance Strikes |
|---|
| SPX Levels: [5000, 5100, 5200, 5150] |
| SPY Levels: [515, 510, 520, 514] |
| NDX Levels: [18000, 18300, 17750, 18500] |
| QQQ Levels: [440, 444, 445, 442] |
| SPX Combos: [(5400,97.51), (5348,90.43), (5328,79.45), (5312,75.54), (5302,98.68), (5276,87.18), (5261,91.48), (5250,98.39), (5240,85.46), (5230,89.77), (5224,95.14), (5219,87.10), (5209,96.05), (5204,80.03), (5199,99.97), (5193,89.14), (5188,94.57), (5183,87.23), (5178,95.52), (5173,98.68), (5168,97.21), (5163,96.48), (5157,95.25), (5152,98.90), (5147,78.06), (5142,81.81), (5132,76.54), (5111,77.90), (5101,89.05), (5090,78.73), (5013,86.80), (4997,87.84), (4951,80.27)] |
| SPY Combos: [524.46, 519.31, 534.24, 521.89] |
| NDX Combos: [18481, 18353, 18243, 17456] |
| QQQ Combos: [438.58, 431.46, 450.6, 456.84] |
SPX Gamma Model
$4,153$4,703$5,253$6,189Strike-$1.8B-$1.1B-$340M$973MGamma NotionalPut Wall: 4800Call Wall: 5200Abs Gamma: 5000Vol Trigger: 5095Last Price: 5157
Strike: $5,697
- Next Expiration: $387,550,656
- Current: $389,844,247
View All Indices Charts