loader image

Informe Option Levels

Mar 13, 2024 | Option Levels

Macro Theme:


Short Term SPX Resistance: 5,200

Short Term SPX Support: 5,100

SPX Risk Pivot Level: 5,100

Major SPX Range High/Resistance: 5,200 SPX Call Wall – 5,211 (520 SPY Call Wall)

Major SPX Range Low/Support: 5,000

‣ 5,200 is the upside target.*

‣ 5,100 is critical support, up from 5,000 the week ending 3/1.*

‣ We look for index volatility to now contract (ref: 2/23, 1-month realized vol 14%, VIX 14.2).

‣ The week of 3/11 is the next major inflection point: 3/12 CPI, 3/14 PPI, March Quarterly OPEX (3/15), 3/18 NVDA Event, followed by 3/20 FOMC & VIX exp.*

*updated 3/4


Founder’s Note:

ES futures are +10bps to 5,247, NQ futures are flat at 18,482.

Key SG levels for the SPX are:

  • Support: 5,160, 5,150, 5,115 (SPY 510), 5,100
  • Resistance: 5,200 (SPX

    Call Wall

    ), 5,211 (SPY 520

    Call Wall

    ), 5,226

  • 1 Day Implied Range: 0.54%

For QQQ:

  • Support: 440, 437
  • Resistance: 445, 450

    Call Wall

IWM:

  • Support: 204, 200, 194
  • Resistance: 210

    Call Wall

There is little on the data docket for today, outside of the 1pm ET 30 year bond auction.

In Monday’s AM note we outlined our price map, which is shown below. Thus far, the SPX held the lower 5,100 bound on Monday, and closed last night around 5,175. As you can see, that is up near heavy 5,200 – 5,210 (SPY 520

Call Wall

) resistance – a level which we think holds until Friday’s OPEX.

The second core view we had into this time window was that volatility would reduce into OPEX – a factor which has not yet come into play. SPX 5 day realized volatility [RV] stands at 10%, with 1-month realized volatility at 12.5% That 1-month realized vol reading is near YTD highs, despite the equity market being at highs.

Despite these RV readings, implied volatility was crushed yesterday after the CPI reading. You can see this via the collapse in SPX term structure from Monday night (gray) to this AM (green). Interestingly this IV deflation happened across the curve, despite PPI tomorrow AM and FOMC on 3/20. Its as if traders feel the CPI eliminated some FOMC tail risk. Regardless of how you feel about FOMC, traders seem to be pricing in a rather quiet period over the next 4-5 sessions. This would seem to agree with our 5,100-5,200 “neutral zone”, and the tight 55bps in our SG 1-day implied move.

This should therefore lead to volatility/trading ranges tightening into Friday.

Turning to the single stock side, one of the reasons we have been looking for equity consolidation has been the break down in single stock call skews. This appears to still be a factor, as shown below in the plot of Skew Rank(%’ile, y axis) vs IV Rank (%’ile, x axis). Extreme bullishness would appear as a concentrated red circle in the top left of the chart, which is what we saw a few weeks ago. Currently we see skews flattening/shifting which is a signal that call demand has declined, and we also see an increase in IV. Taken together its a signal of short term topping. The reality is that the leading chip stocks are broadly down week-over-week (SMH -3% this week), and we do not anticipate another major leg higher this week. The big “risk back on” triggers lie next week with NVDA/FOMC, and a break >5,200 in the SPX.


SpotGamma Proprietary Levels

SPX

SPY

NDX

QQQ

RUT

IWM

Reference Price:

$5175

$516

$18219

$443

$2065

$204

SpotGamma Implied 1-Day Move:

0.54%

0.54%

SpotGamma Implied 5-Day Move:

1.95%

SpotGamma Volatility Trigger™:

$5095

$516

$17740

$437

$2040

$204

Absolute Gamma Strike:

$5150

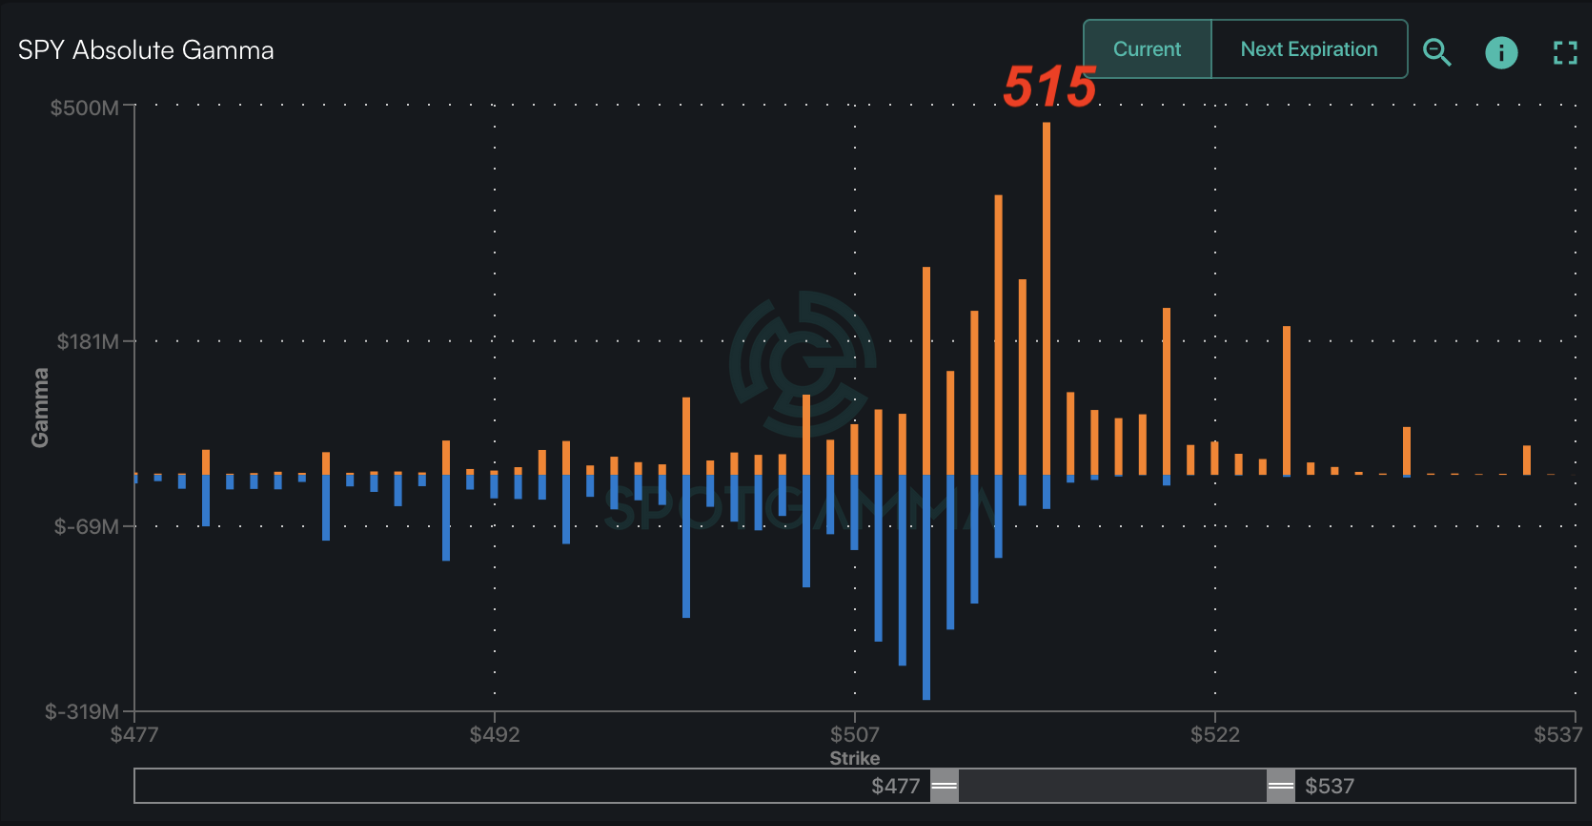
$515

$18000

$440

$2050

$205

SpotGamma Call Wall:

$5200

$520

$17750

$445

$2050

$210

SpotGamma Put Wall:

$4800

$500

$17500

$425

$1900

$198

Additional Key Levels

SPX

SPY

NDX

QQQ

RUT

IWM

Zero Gamma Level:

$5106

$512

$17370

$439

$2060

$203

Gamma Tilt:

1.387

1.172

1.373

1.303

1.058

1.154

SpotGamma Gamma Index™:

2.437

0.177

0.062

0.122

0.007

0.029

Gamma Notional (MM):

$507.859M

$807.981M

$5.542M

$395.45M

‑$1.55M

$250.372M

25 Delta Risk Reversal:

-0.021

-0.019

-0.022

-0.024

0.005

-0.005

Call Volume:

662.296K

2.091M

7.012K

930.558K

23.408K

528.794K

Put Volume:

1.21M

2.864M

8.35K

1.286M

31.914K

831.434K

Call Open Interest:

7.61M

6.927M

57.265K

4.571M

291.202K

4.837M

Put Open Interest:

15.059M

17.096M

76.896K

8.771M

516.665K

8.673M

Key Support & Resistance Strikes

SPX Levels: [5150, 5200, 5000, 5100]

SPY Levels: [515, 520, 516, 510]

NDX Levels: [18000, 18300, 17750, 18150]

QQQ Levels: [440, 445, 444, 439]

SPX Combos: [(5398,97.81), (5377,75.31), (5351,92.75), (5325,75.48), (5310,85.43), (5299,98.53), (5289,77.17), (5274,91.69), (5268,74.76), (5258,92.56), (5248,99.09), (5243,87.44), (5237,81.66), (5232,90.08), (5227,99.30), (5222,89.63), (5217,90.29), (5211,93.57), (5206,99.55), (5201,99.97), (5196,93.64), (5191,92.49), (5186,94.93), (5180,91.54), (5175,98.97), (5170,94.10), (5160,81.47), (5108,81.70), (5098,88.61), (5015,77.31), (4999,90.29), (4948,80.31), (4927,72.53)]

SPY Combos: [525.08, 535.42, 530.25, 522.49]

NDX Combos: [18274, 18474, 18237, 18693]

QQQ Combos: [438.95, 445.61, 436.28, 451.38]

SPX Gamma Model

$4,167$4,717$5,267$6,210Strike-$1.8B-$1B-$283M$467M$1.2BGamma NotionalPut Wall: 4800Call Wall: 5200Abs Gamma: 5150Vol Trigger: 5095Last Price: 5175

View All Indices Charts


©2024 TenTen Capital LLC DBA SpotGamma