
Macro Theme:
Short Term SPX Resistance: 5,265 (SPY 525)
Short Term SPX Support: 5,200
SPX Risk Pivot Level: 5,200
Major SPX Range High/Resistance: (5,265 SPY 525)
Major SPX Range Low/Support: 5,000
‣ 5,265 is the upside target.*
‣ 5,200 is critical support, up from 5,100 on 3/20. Below 5,200 is our risk off indicator.*
‣ 5,300 is our target into March month end.*
‣ NVDA’s event on 3/18 failed to renew the call bid in the chip sector, likely triggering longer term consolidation in the space (ref: 216 in SMH).**
*updated 3/22
**updated 3/19
Founder’s Note:
ES are -15bps to 5,285. NQ futures are -20bps to 18,540.
Key SG levels for the SPX are:
- Support: 5,234, 5,224, 5,210, 5,200
- Resistance: 5,250, 5,265 (SPY
Call Wall
)
- 1 Day Implied Range: 0.53%
For QQQ:
- Support: 440, 430
- Resistance: 446, 450
IWM:
- Support: 200
- Resistance: 210
Call Wall
Treasury bill auction at 11:30AM ET, and a 2 year note auction at 1pm ET.
The zone of 5,200-5,300 is filling in with gamma positions as the SPX stalled near 5,250 late last week. Will that, our volatility expectations have declined, with the 1-day SG implied move coming in at a scant 53bps. We continue to target the 5,300 upside strike for this final week of trading in March (recall that Friday is a market holiday). 5,200 remains critical market support – below that level our models flip to risk-off. Below that level we think traders should position for further downside/higher vol, whereas >5200 we favor buying dips.
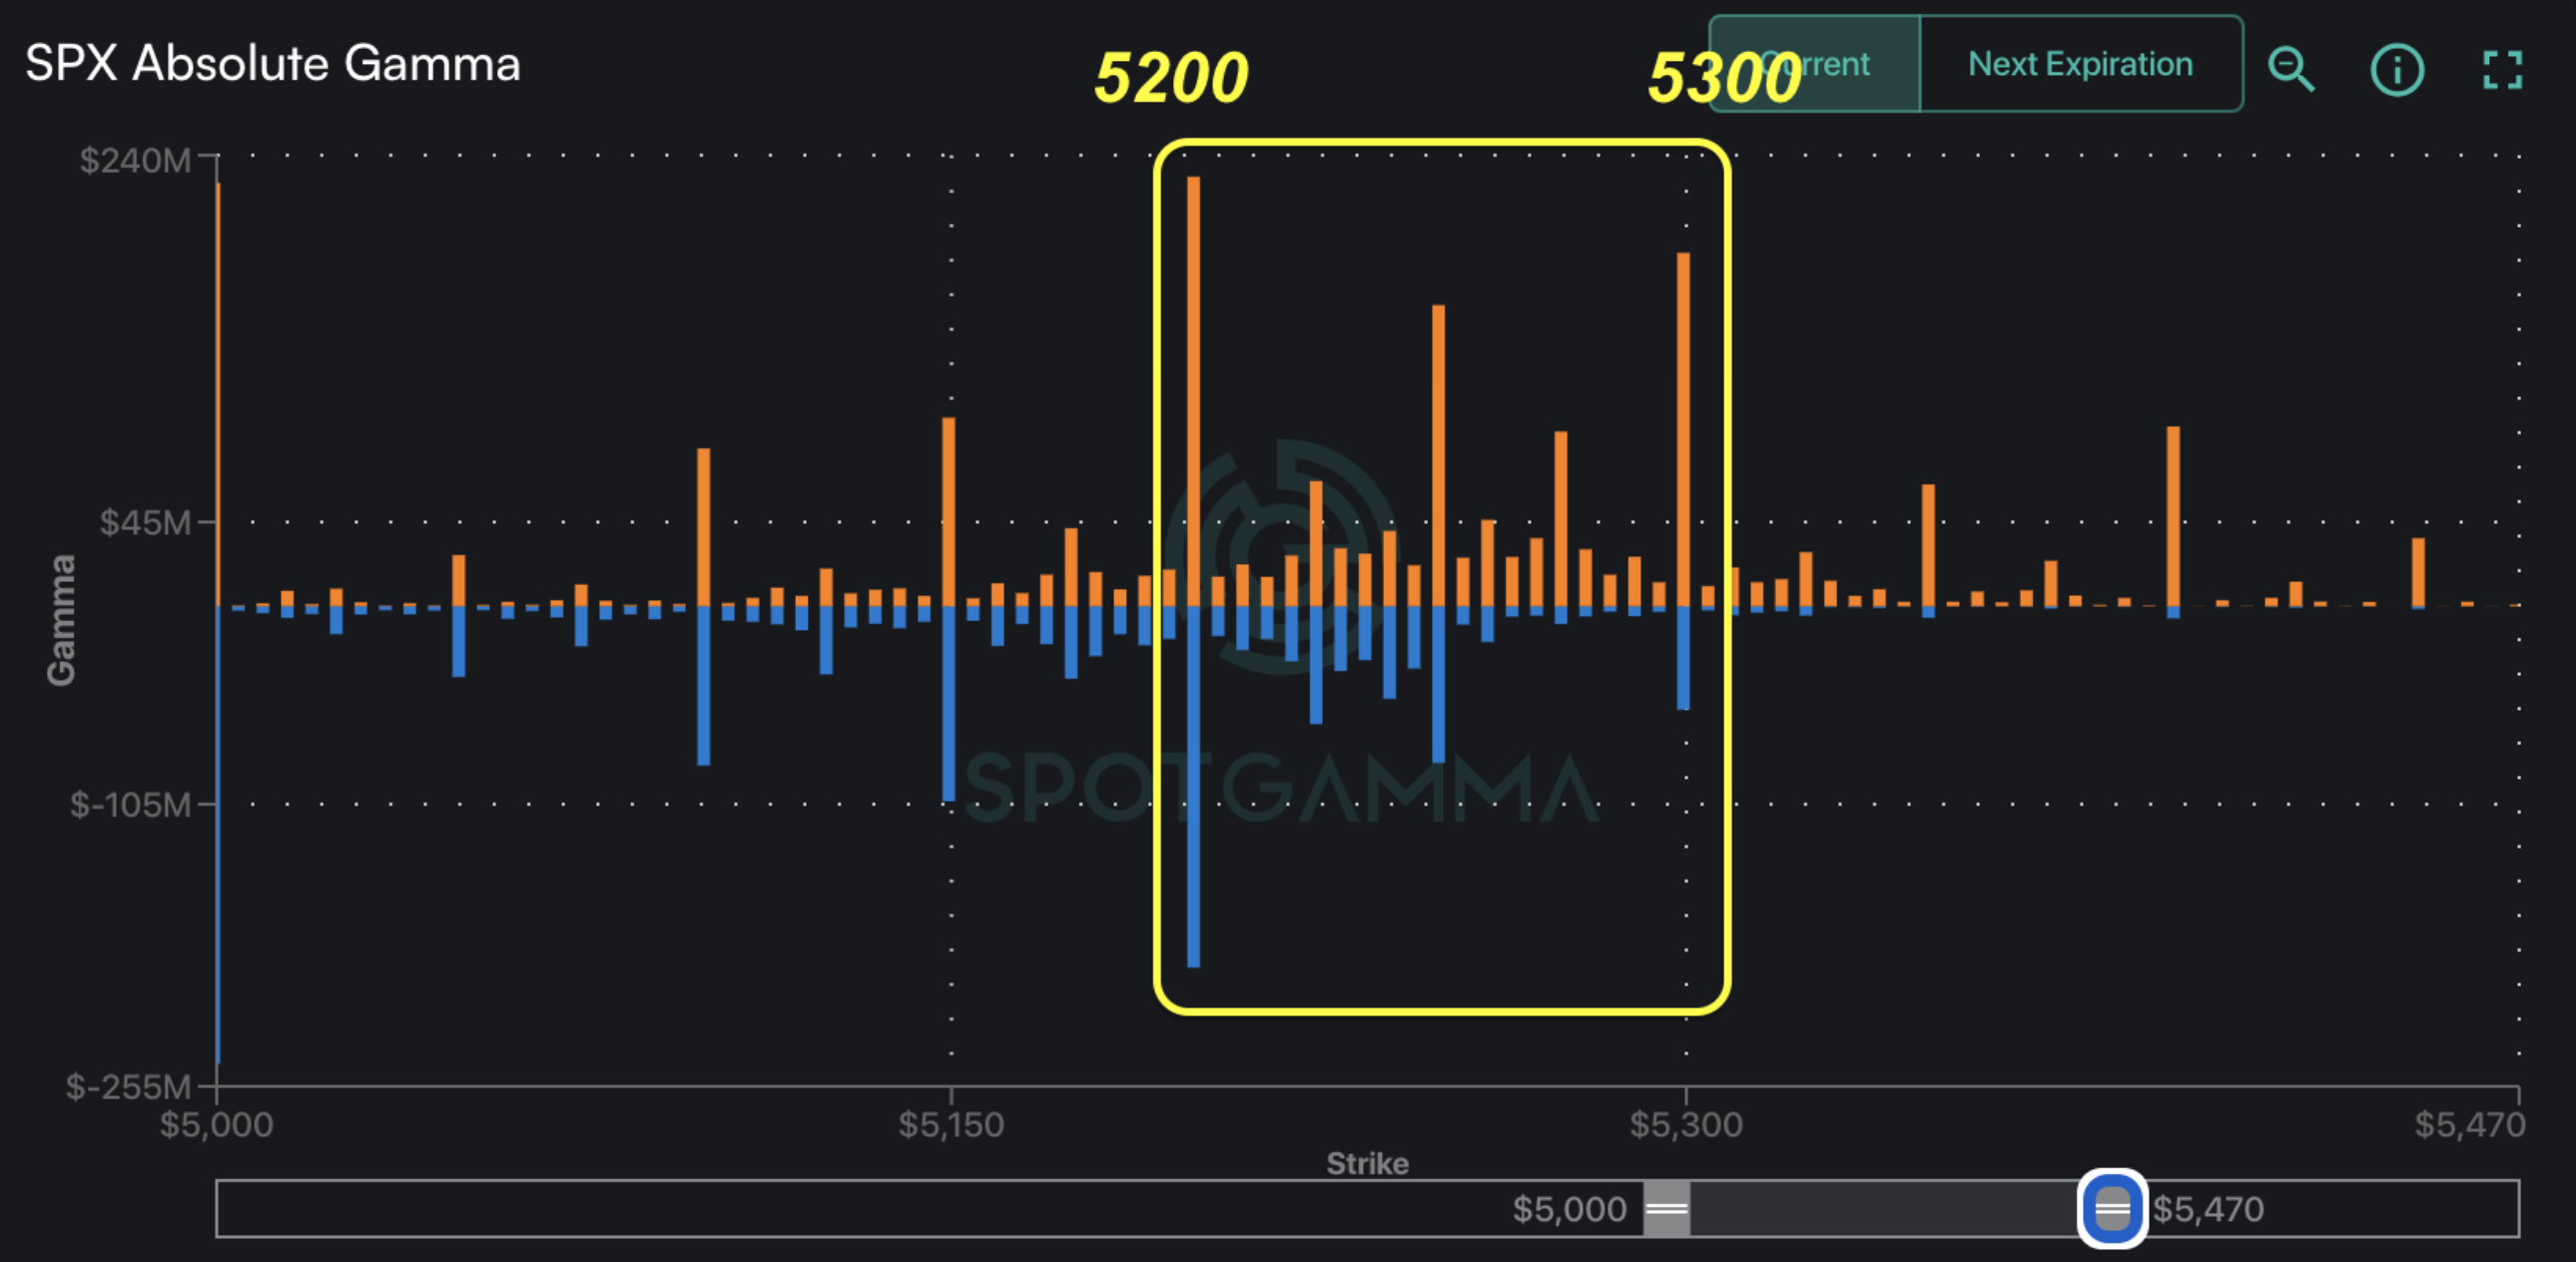
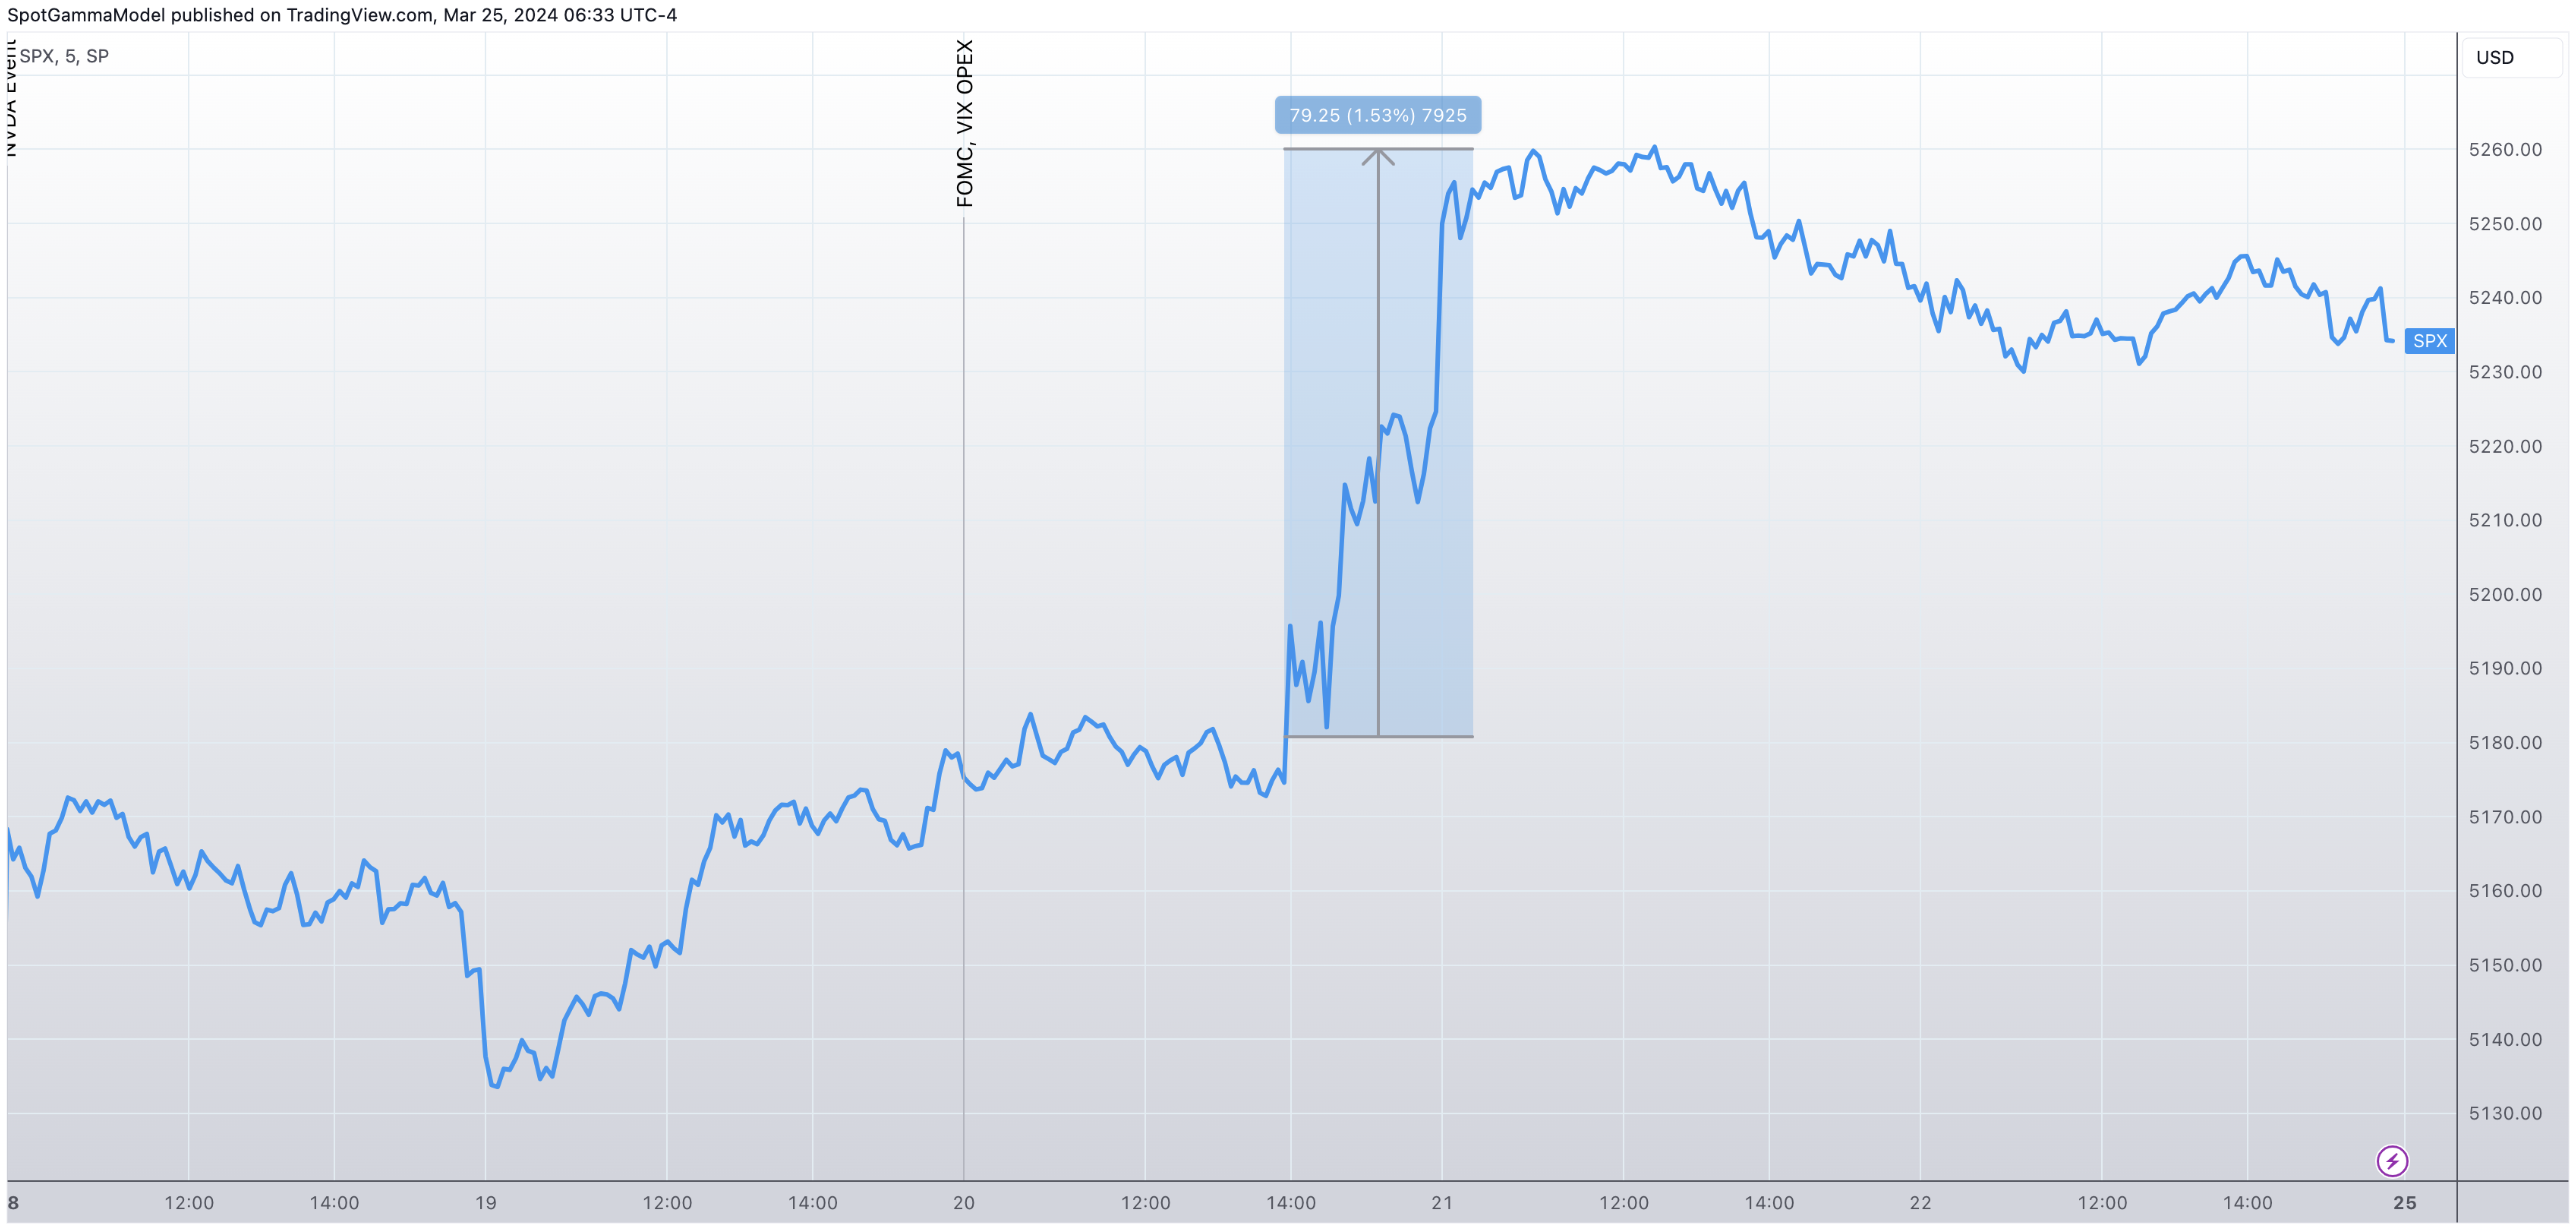
There was a lot of upside price volatility immediately after FOMC, with 1.5% of SPX gains the afternoon of 3/20 into Thursday AM. Then, things stalled. We would argue that is fair price action, as the FOMC event vol was released, resulting in a pop in risk assets. With that pop, heavy, short dated options traders enter the market, which fills in the prevailing trading range (in this case, 5,200-5,300), and stifles index price action.
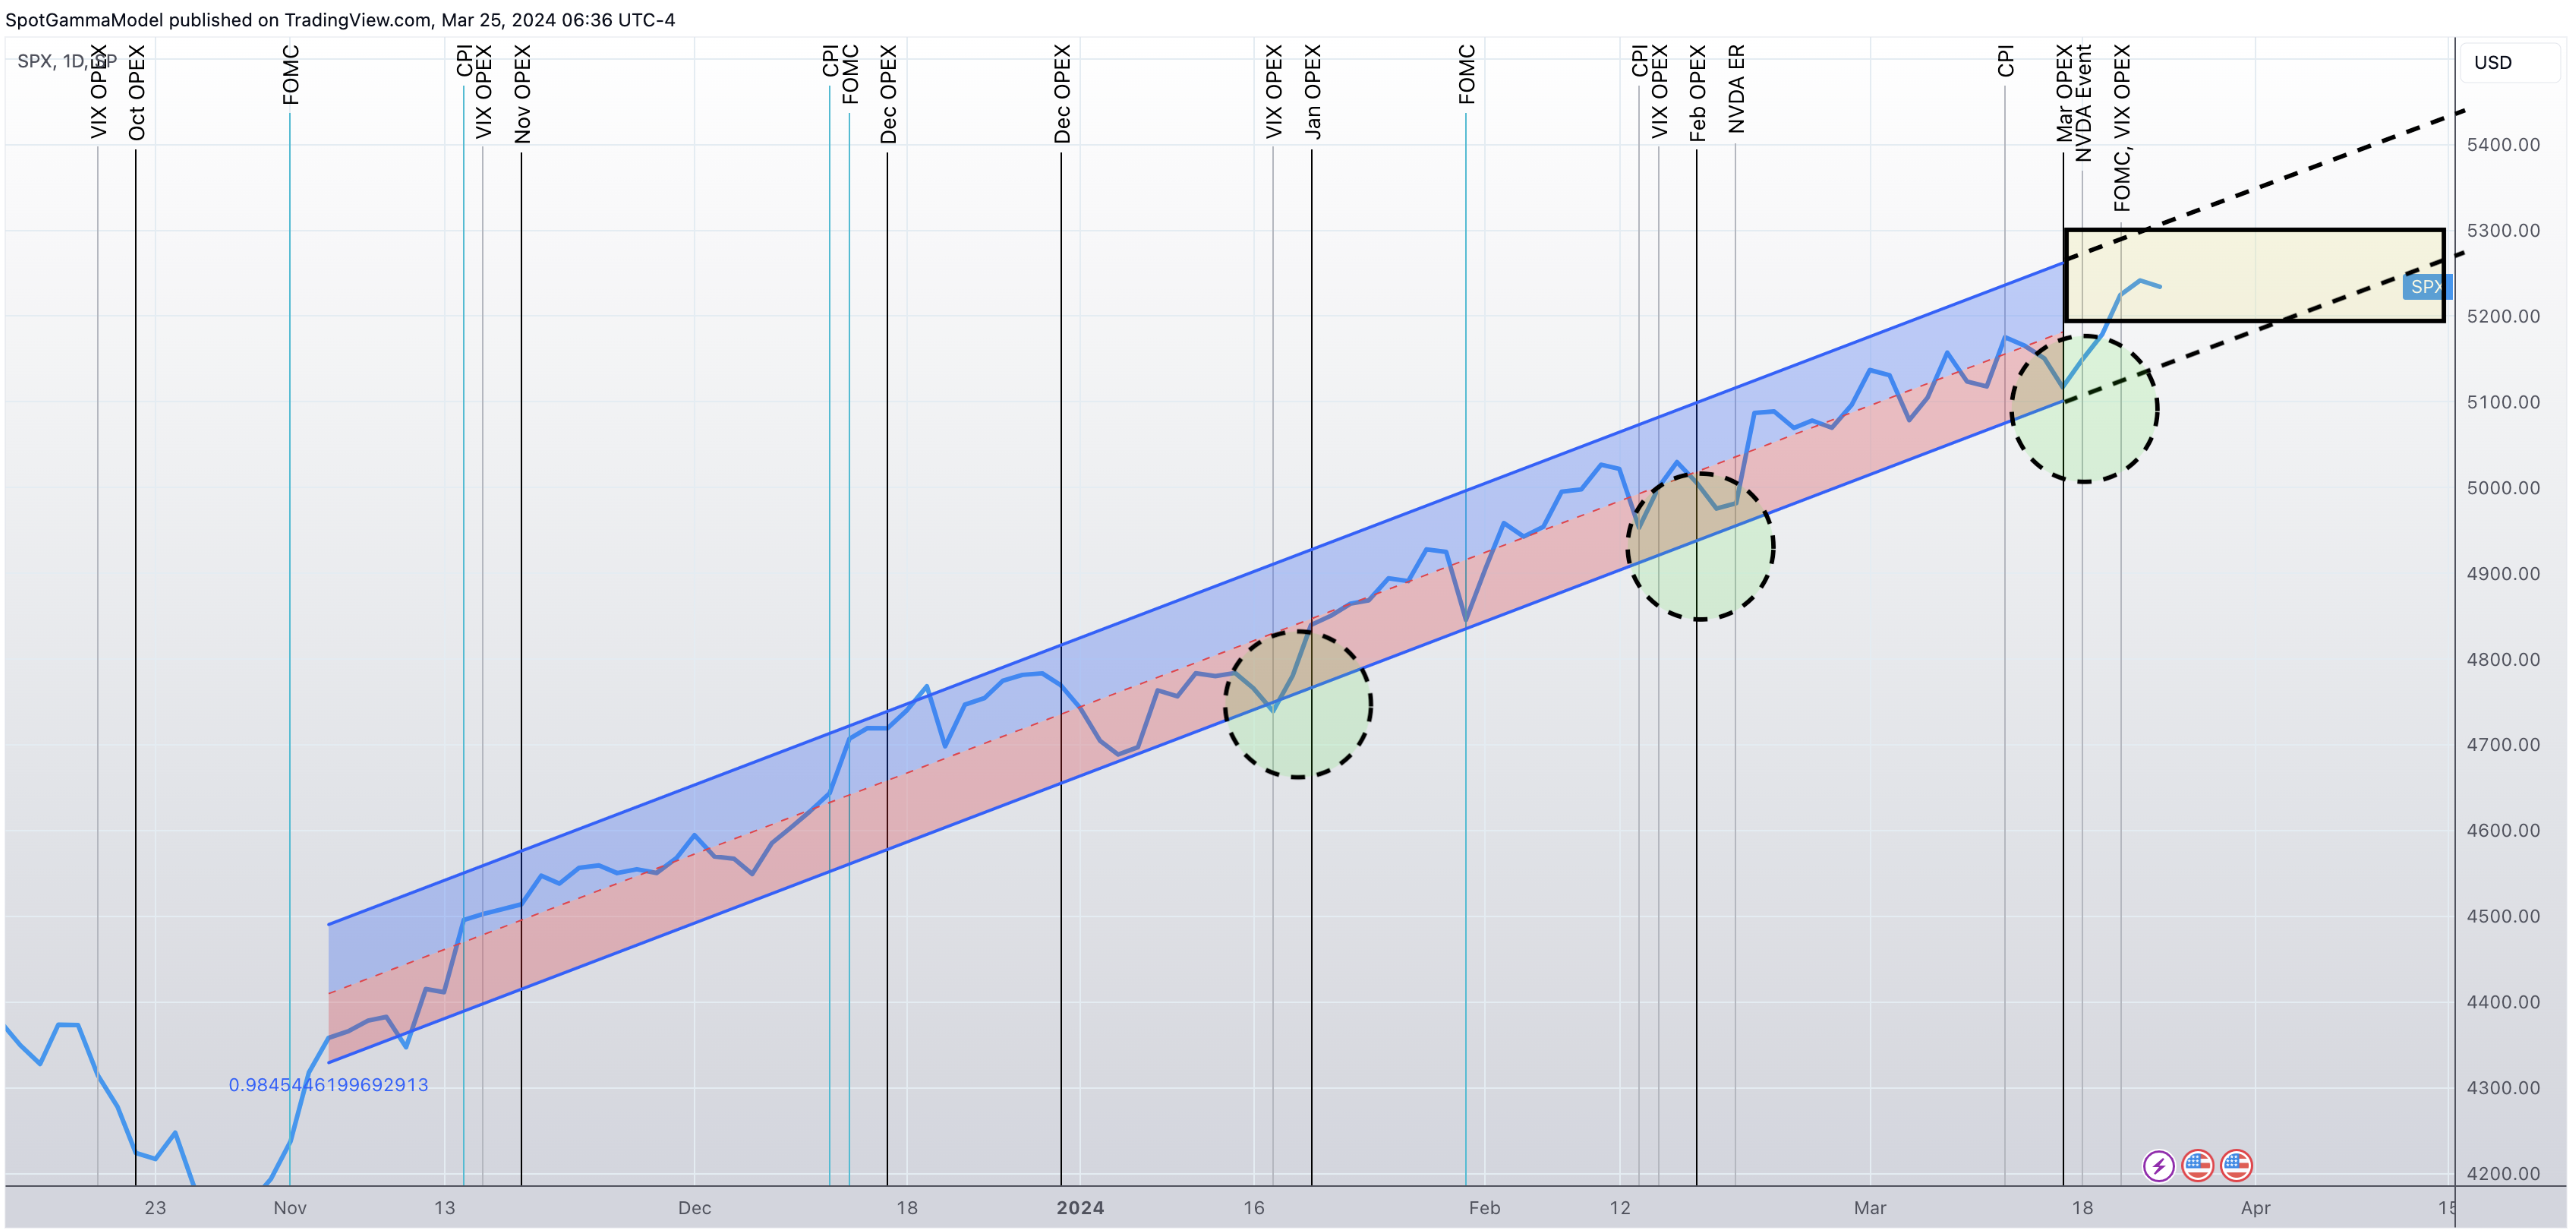
This “pop and grind” has been the cadence for most of this year. We’ve boiled this down recently into a trend channel, wherein you can see that relative market weakness has existed into each of this years monthly expirations (green circles). Into each of these expirations there were
large gamma strikes
that were cleared away, allowing for a step higher in SPX prices. Into Jan OPEX it was 4900 strike resistance cleared, Feb: 5000, March: 5200. Into April we are setting up to rotate into the 5200-5300 range (yellow box). While we forecast the SPX to now drift, single stocks are left to move at their own pace (often times at a faster pace), which is why we have low correlation (as laid out on Friday, read here).
While many want to call a market top due to this exuberant environment, there is no signal in vols that anyone wants to own downside protection. And, the issue with trying to call tops, is that the market feedback loop is reflexively bidding to the upside. Whether its a decline in SPX realized vol, systematic call overwriting, speculative single stock bids, downside put sellers – those flows all work to support equity markets. This suggests the trend higher remains in tact until an “unknown” comes across to break those reflexive flows. This could be something like SVB, significant geopolitical escalations, etc.
As far as understanding if the market is treating declines as a true “risk-off” vs simple consolidation, we must monitor changes to skews & fixed strike vol into periods of weakness. In our current case, the short term sell signal is generated by a break of 5,200, and then we will be closely watching IV readings to determine if traders are selling vol/puts into weakness (aka buying the dip), or if a more meaningful put bid is at hand. One should expect a rather violent short vol cover/put bid into any type of true risk off.
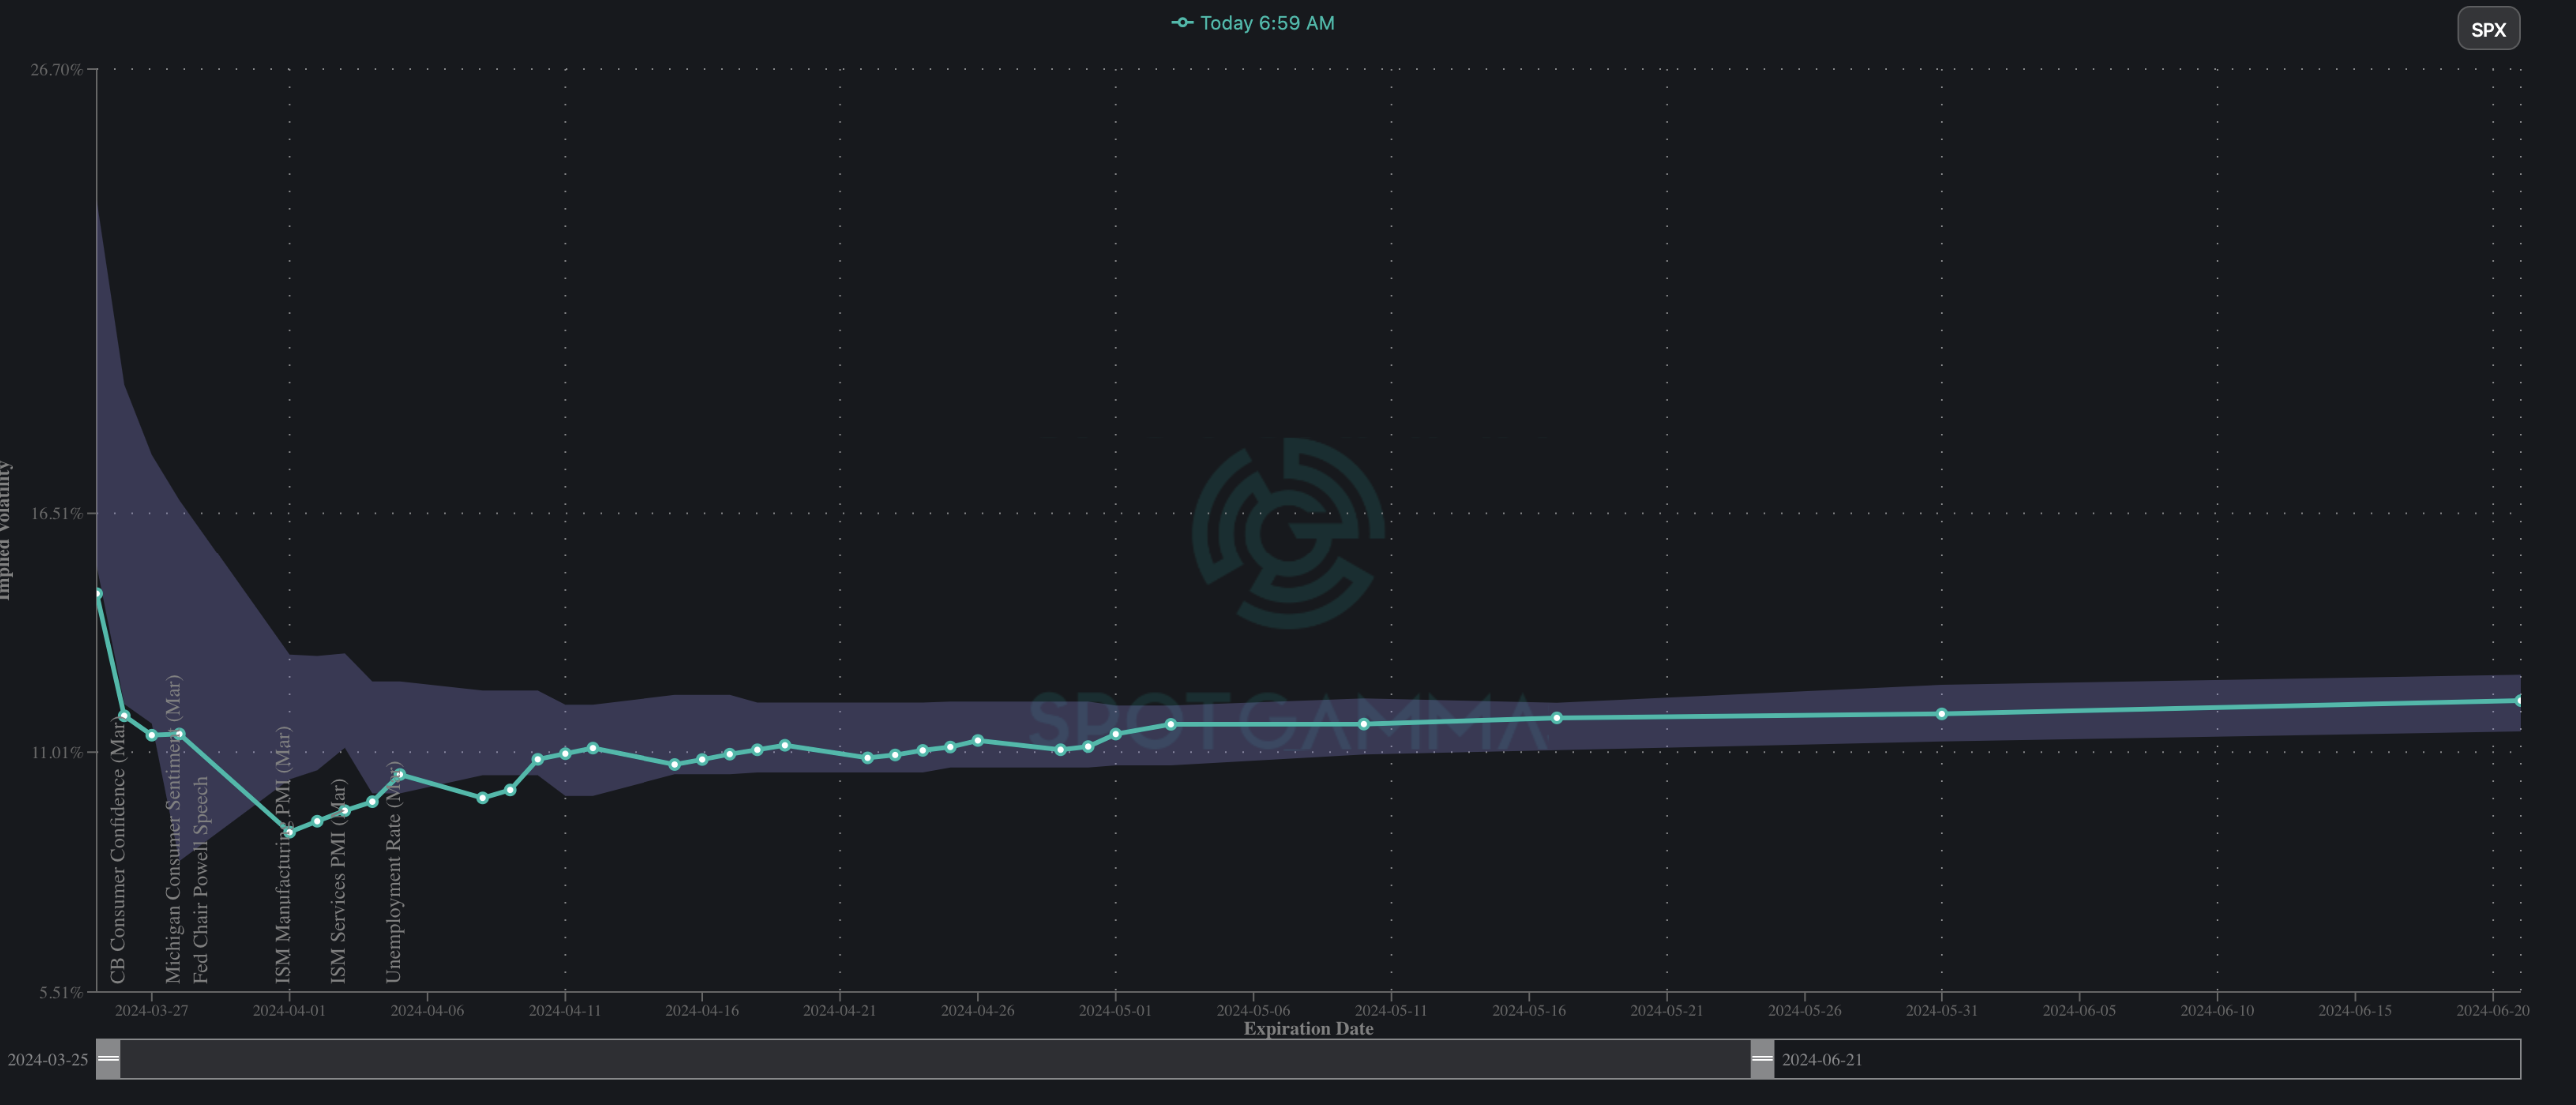
As far as where we sit today – well, traders have no concerns. Shown below is the SPX term structure, and as you can see we are at the lows of readings over the past several months (shaded gray cone). Further, as this is a shorter week, traders may be even less incentivized to want to carry long vol positions.
| SpotGamma Proprietary Levels | SPX | SPY | NDX | QQQ | RUT | IWM |
|---|---|---|---|---|---|---|
| Reference Price: | $5234 | $317 | $18339 | $446 | $2072 | $205 |
| SpotGamma Implied 1-Day Move: | 0.53% | 0.67% |
|
|
|
|
| SpotGamma Implied 5-Day Move: | 1.24% |
|
|
|
|
|
| SpotGamma Volatility Trigger™: | $5190 | $522 | $17850 | $446 | $2025 | $204 |
| Absolute Gamma Strike: | $5000 | $520 | $17900 | $445 | $2100 | $200 |
| SpotGamma Call Wall: | $5300 | $525 | $17900 | $454 | $2040 | $215 |
| SpotGamma Put Wall: | $4800 | $500 | $17500 | $430 | $1700 | $200 |
| Additional Key Levels | SPX | SPY | NDX | QQQ | RUT | IWM |
|---|---|---|---|---|---|---|
| Zero Gamma Level: | $5203 | $349 | $17354 | $445 | $2082 | $206 |
| Gamma Tilt: | 1.209 | 1.013 | 1.596 | 0.928 | 0.910 | 0.824 |
| SpotGamma Gamma Index™: | 1.236 | 0.005 | 0.053 | -0.028 | -0.006 | -0.032 |
| Gamma Notional (MM): | $441.76M | ‑$351.78M | $5.80M | $44.041M | ‑$5.163M | ‑$191.949M |
| 25 Delta Risk Reversal: | -0.017 | 0.00 | 0.00 | 0.002 | 0.00 | 0.013 |
| Call Volume: | 503.185K | 6.269M | 9.002K | 608.005K | 17.669K | 488.032K |
| Put Volume: | 1.054M | 7.181M | 10.182K | 820.852K | 38.971K | 569.327K |
| Call Open Interest: | 6.491M | 5.952M | 38.743K | 3.483M | 208.457K | 3.982M |
| Put Open Interest: | 13.137M | 14.936M | 56.886K | 6.437M | 387.487K | 7.281M |
| Key Support & Resistance Strikes |
|---|
| SPX Levels: [5000, 5200, 5250, 5300] |
| SPY Levels: [520, 523, 525, 524] |
| NDX Levels: [17900, 18000, 18500, 17500] |
| QQQ Levels: [445, 440, 450, 447] |
| SPX Combos: [(5454,92.28), (5402,98.87), (5381,86.42), (5376,75.67), (5355,96.96), (5334,78.63), (5328,86.17), (5323,87.41), (5313,90.04), (5302,99.77), (5297,86.84), (5292,85.91), (5287,87.22), (5281,99.32), (5276,97.21), (5271,89.29), (5266,97.70), (5260,95.42), (5255,99.99), (5250,100.00), (5245,100.00), (5239,99.79), (5234,99.82), (5229,96.31), (5224,98.44), (5218,81.53), (5213,90.94), (5203,84.99), (5192,81.29), (5182,72.12), (5171,87.37), (5166,75.91), (5156,74.72), (5145,74.10), (5135,73.23), (5129,84.51), (5124,81.26), (5103,75.50), (5077,74.87), (5056,74.95), (5025,82.05), (5004,87.57)] |
| SPY Combos: [522.25, 522.77, 523.29, 521.21] |
| NDX Combos: [18376, 17918, 18670, 18504] |
| QQQ Combos: [447.27, 436.11, 454.41, 450.4] |
SPX Gamma Model
$4,215$4,765$5,315$6,281Strike-$1.5B-$815M-$115M$1.2BGamma NotionalPut Wall: 4800Call Wall: 5300Abs Gamma: 5000Vol Trigger: 5190Last Price: 5234
Strike: $5,610
- Next Expiration: $514,771,643
- Current: $514,939,582
View All Indices Charts
0 comentarios