
Macro Theme:
Short Term SPX Resistance: 5,320 (SPY 530)
Short Term SPX Support: 5,276
SPX Risk Pivot Level: 5,265
Major SPX Range High/Resistance: 5,320 (SPY 530 Call Wall)
Major SPX Range Low/Support: 5,000
- For the week of 5/13 we see several catalysts, which should lead to expanding volatility:
- 5,260 is all-time SPX highs, and a major gamma bar at SPY 525. This is resistance into 5/15 CPI.
- 5,300 is our target max high into Friday OPEX, 5/17.
- 5,200 is major short term support. A break <5,200 pushes the S&P into a more fluid, risk-off zone, with 5,100 becoming the short term downside target.
- 5/22 NVDA earnings, which follows 5/17 OPEX, should be a final major turning point for equities.
*updated 5/13
Founder’s Note:
ES futures are flat at 5,336. NQ futures are +20bps to 18,719.
Key SG levels for the SPX are:
- Support: 5,200, 5,276
- Resistance: 5,313, 5,324, 5,351
- 1 Day Implied Range: 0.58%
For QQQ:
- Support: 450, 442, 440
- Resistance: 453, 457, 460
IWM:
- Support: 202, 200
- Resistance: 210, 212
Philly Fed Prices Paid, Jobless Claims 8:30AM ET.
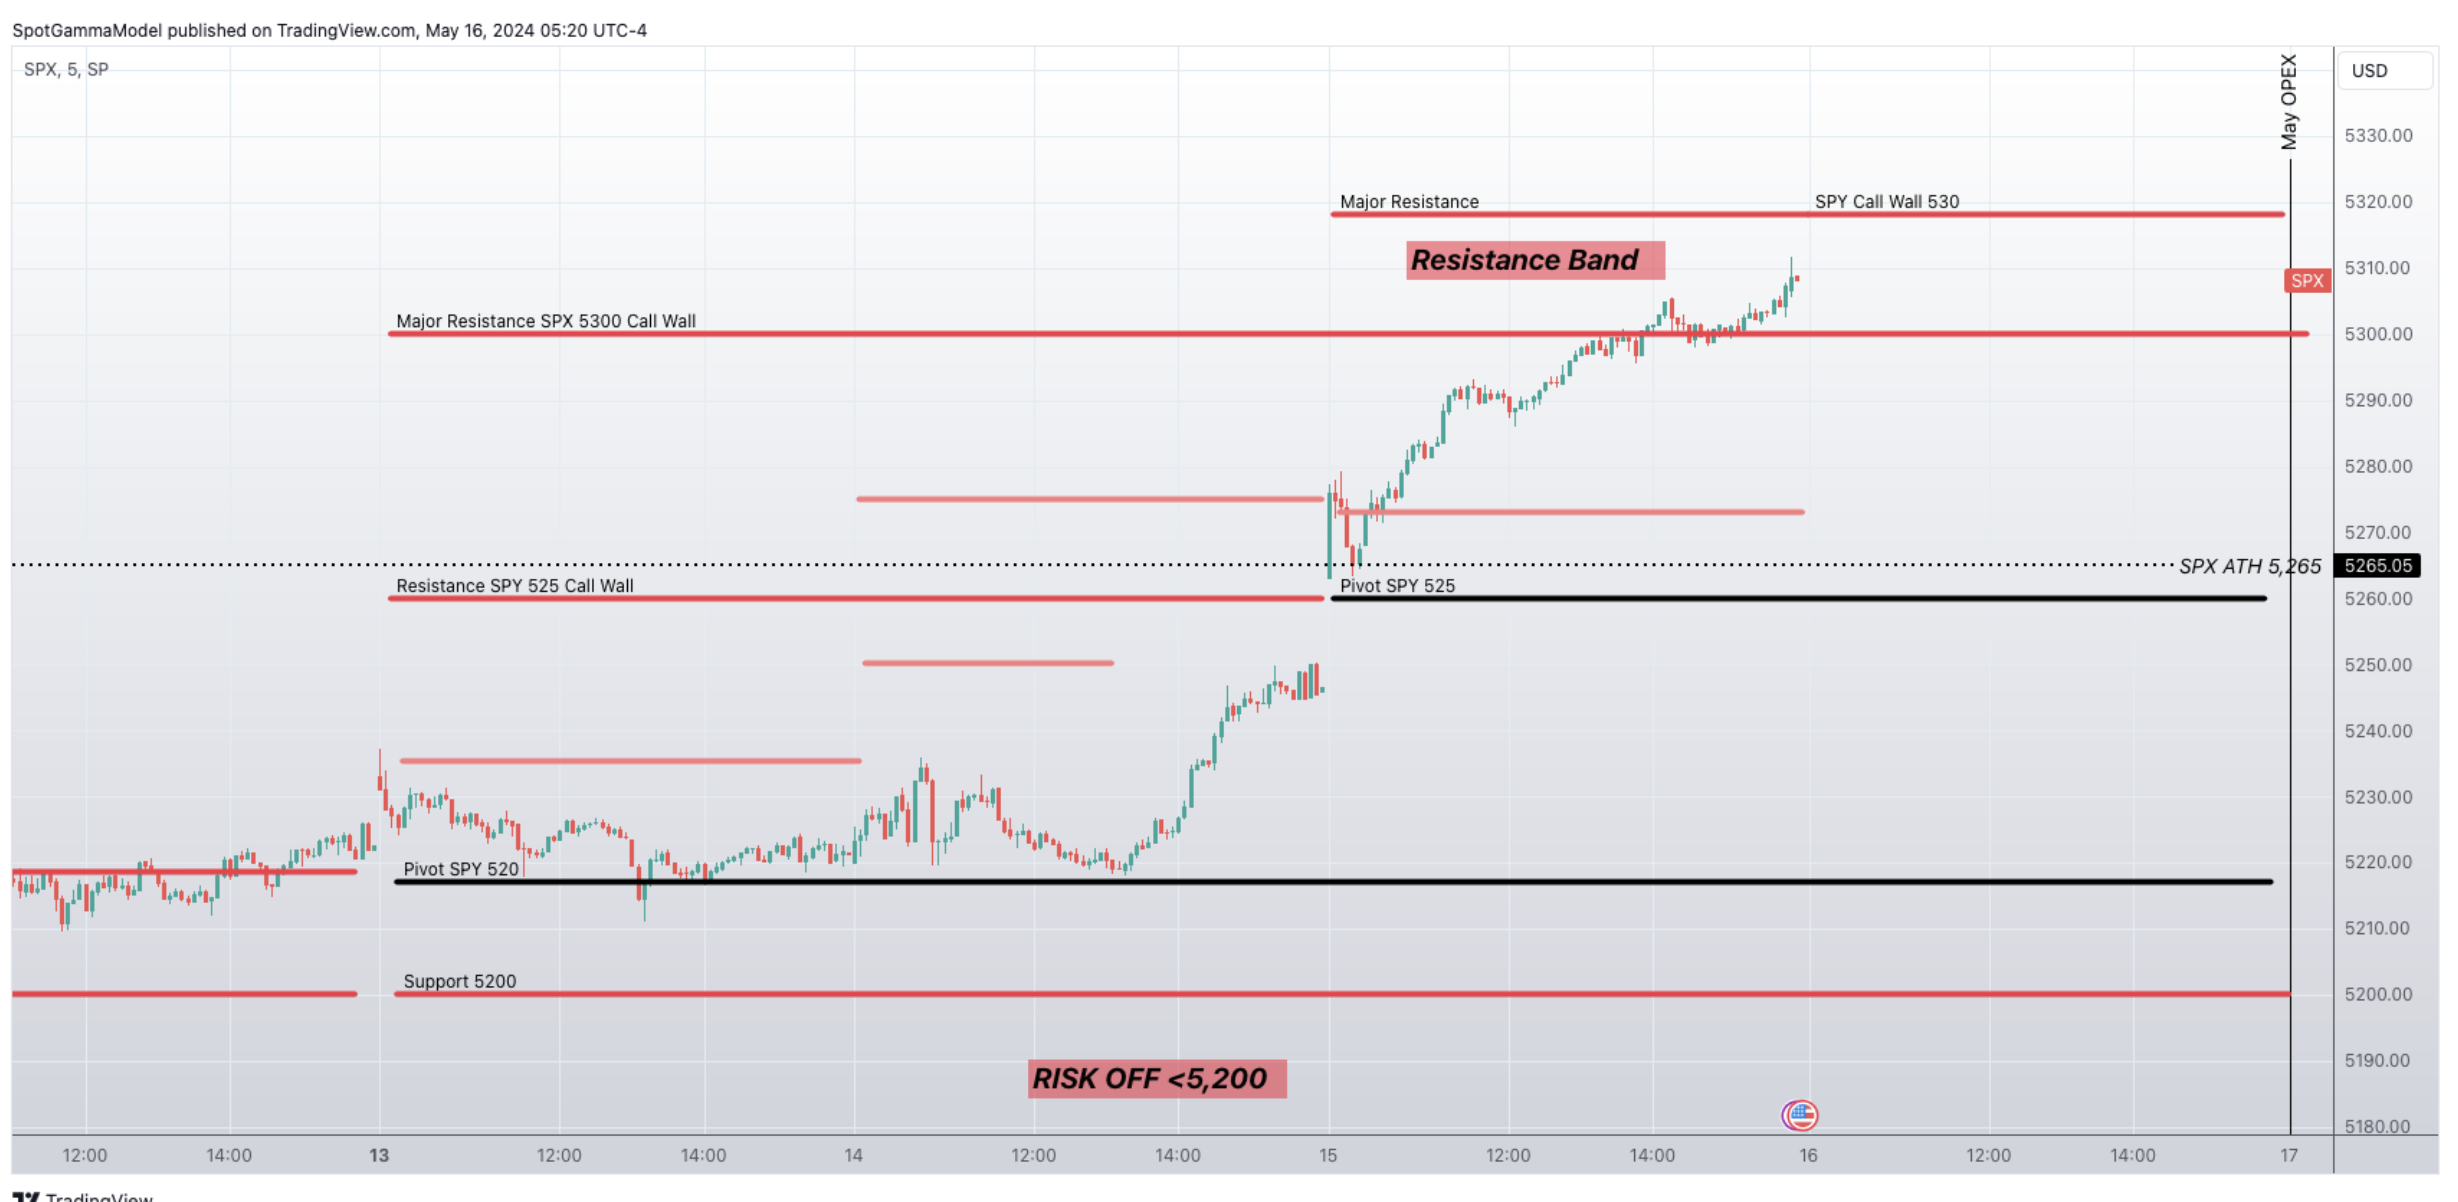
We were looking for a move to 5,300 into Friday OPEX, but CPI triggered the move a bit early. Accordingly, the SPX
Call Wall
remains at 5,300, with the SPY
Call Wall
rolling to 530. This means that the S&P500 is currently sitting in the resistance band we highlighted in yesterday‘s AM note of 5,300-5,325. Additionally in yesterday’s note, we highlighted that this 5,300 – 5,325 is currently the peak gamma area, which should offer the maximum in dealer volatility-suppression. In other words: we’re looking for a pin here, into Friday OPEX.
Then, according to our playbook, the new focus (and catalysts) are next week, with 5/22 Wednesday VIX exp + NVDA earnings. We’d add that the QQQ
Call Wall
has shifted to 460, with IWM still at 210. This implies QQQ has more room to run relative to SPY/IWM.
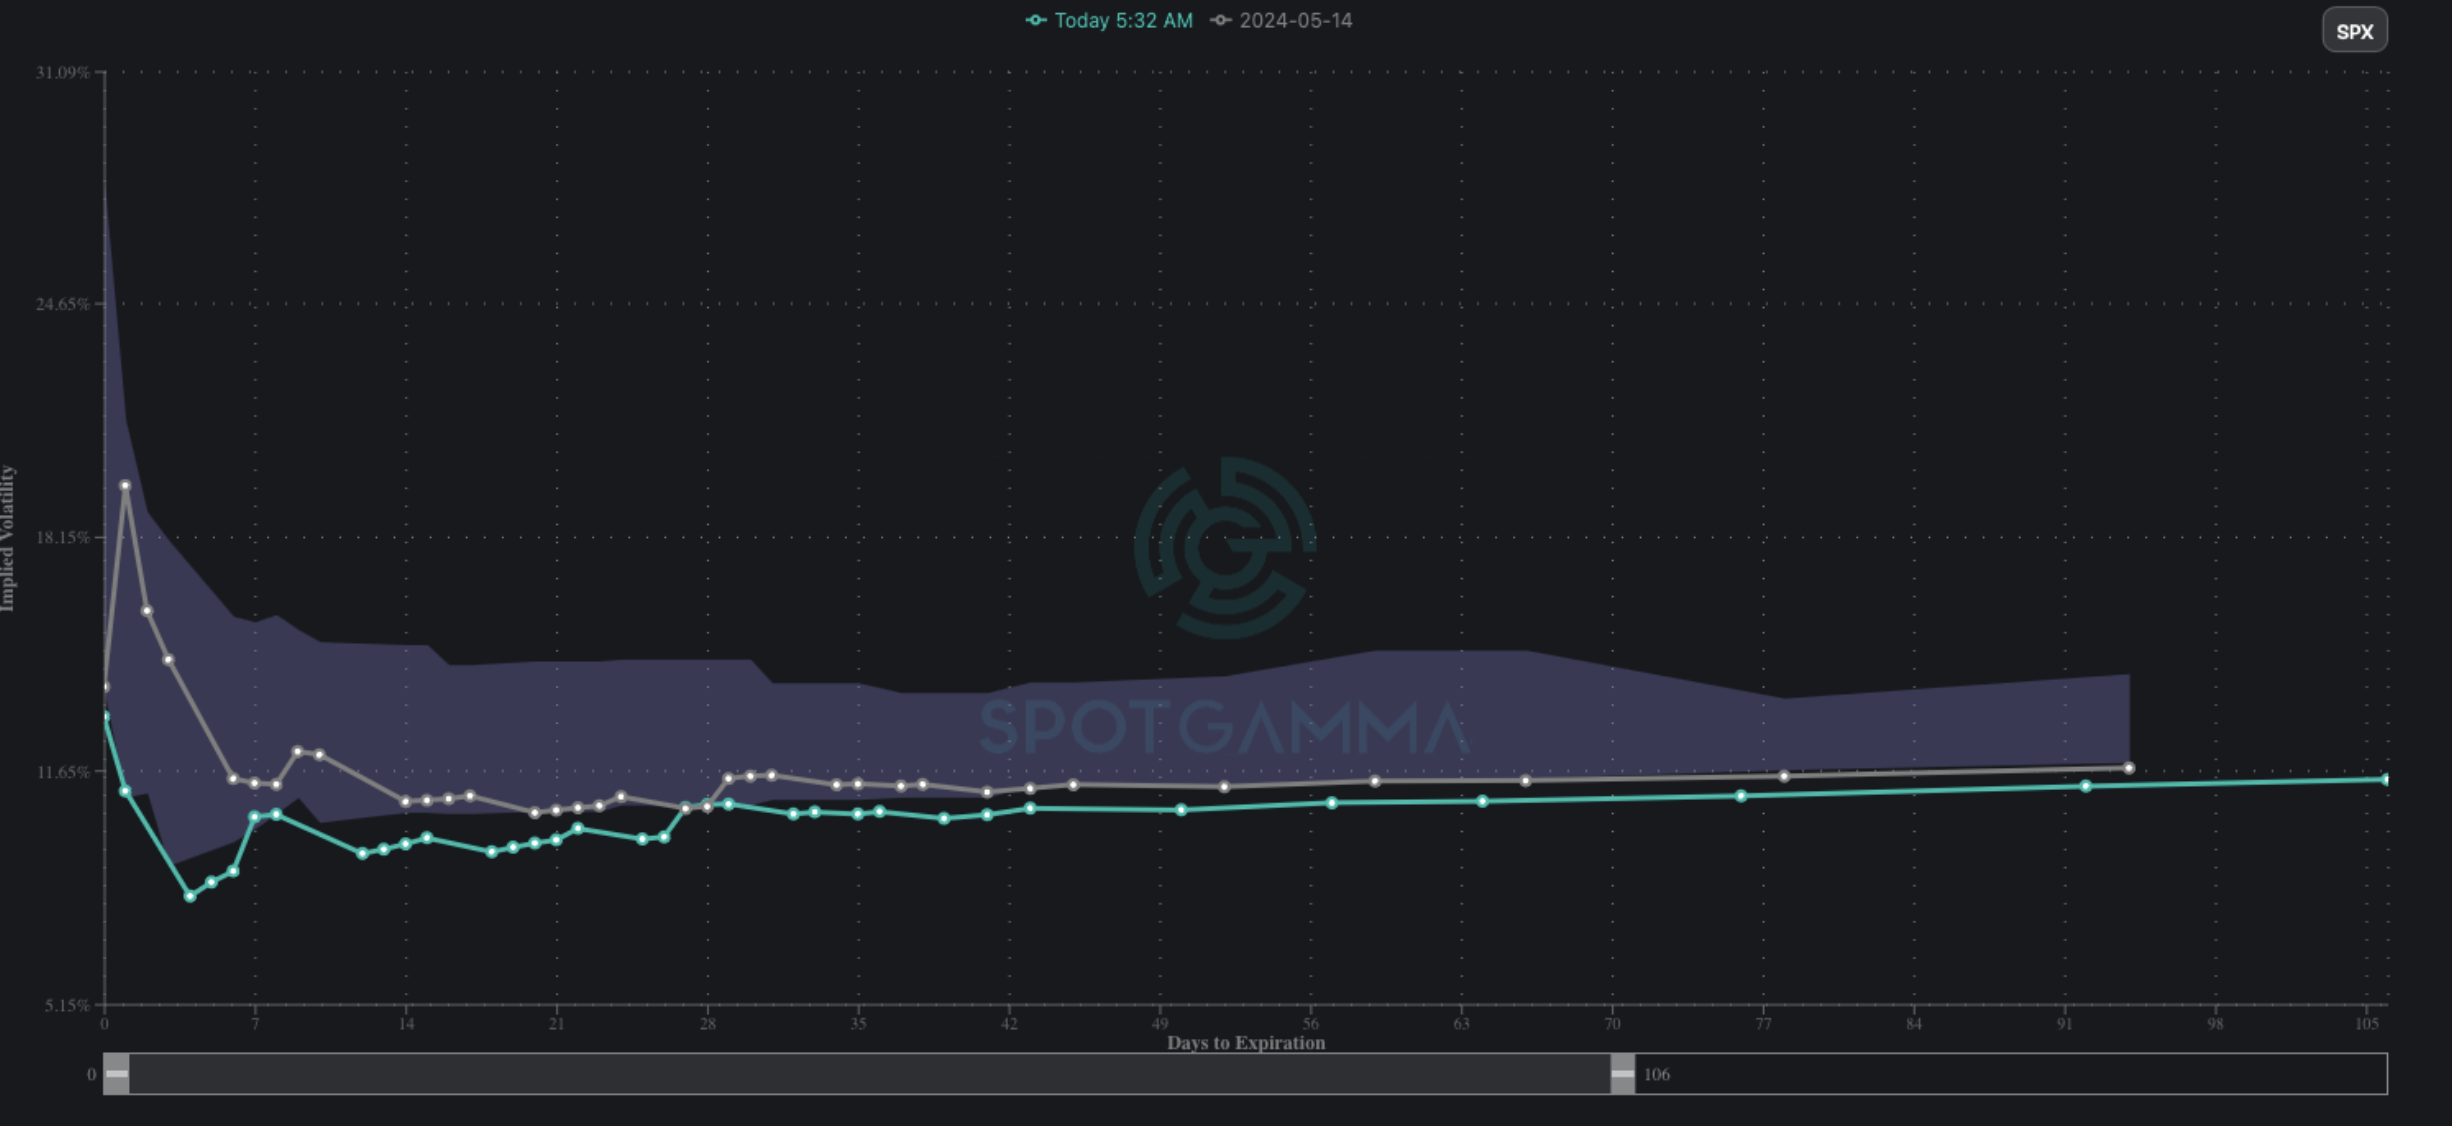
But first, lets talk about the driver for yesterday’s equity pump: implied volatility crush (i.e. vanna).
It was an absolute drilling across the SPX term structure, below. Here we compare the ATM IV from Tuesday night (gray line, pre-CPI) to this morning (teal), and as you can see, we are now at 90-day IV lows. With IV at major lows, there is little IV left to extract, which supports the idea of a pin. Vanna, at least as a catalyst for upside, is largely gone. Additionally, note that IV is de minimis out until the election, which is a signal that traders see very little risk over the next few months.
As far as the next few days go, we see large gamma levels stacked above the current resistance range, and some large gamma bars below. This suggests that mean reversion should be in play over the next several days, revolving around 5,300-5,320. Should the
Call Wall
(s) roll higher, then it would confirm higher possible S&P prices. Buy dips, sell rips is what the data suggests.
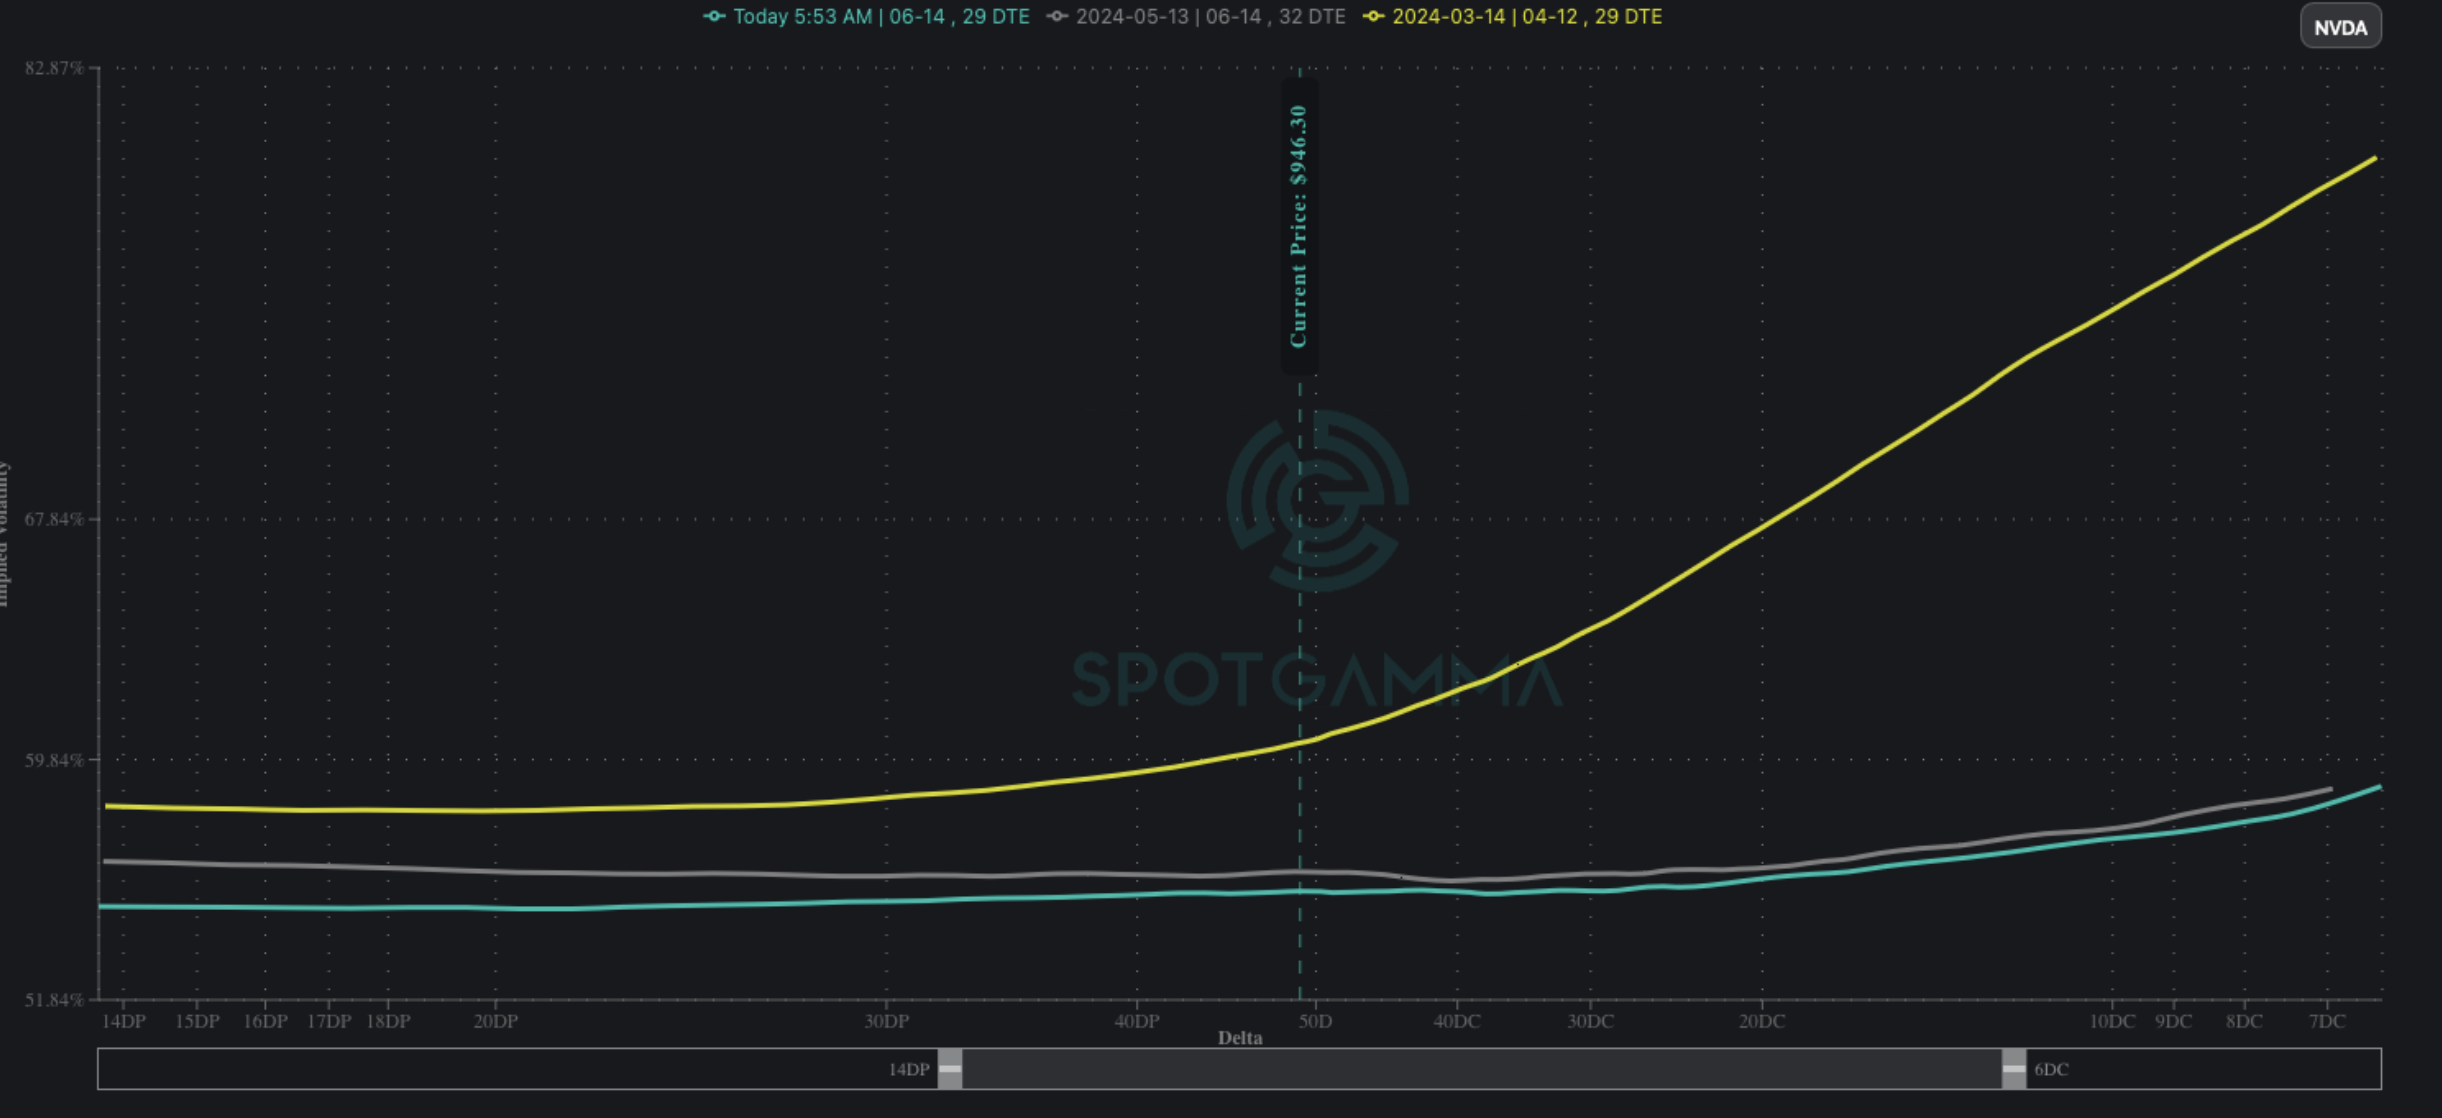
Turning to NVDA as the major catalyst, we recently discussed the lack of call skew heading into this ER (5/22) vs previous ER/events. The stock was up 3.5% yesterday, and its only ~3% from March all-time highs. However, the current 1-month skews (teal) show a much lower relative call skew than vs mid-March (yellow). This suggests that the options market is not “overbought” like it was heading into earnings. A lot can change over the next week, but should this situation remain we think its constructive for the stock, and therefore stocks writ-large.
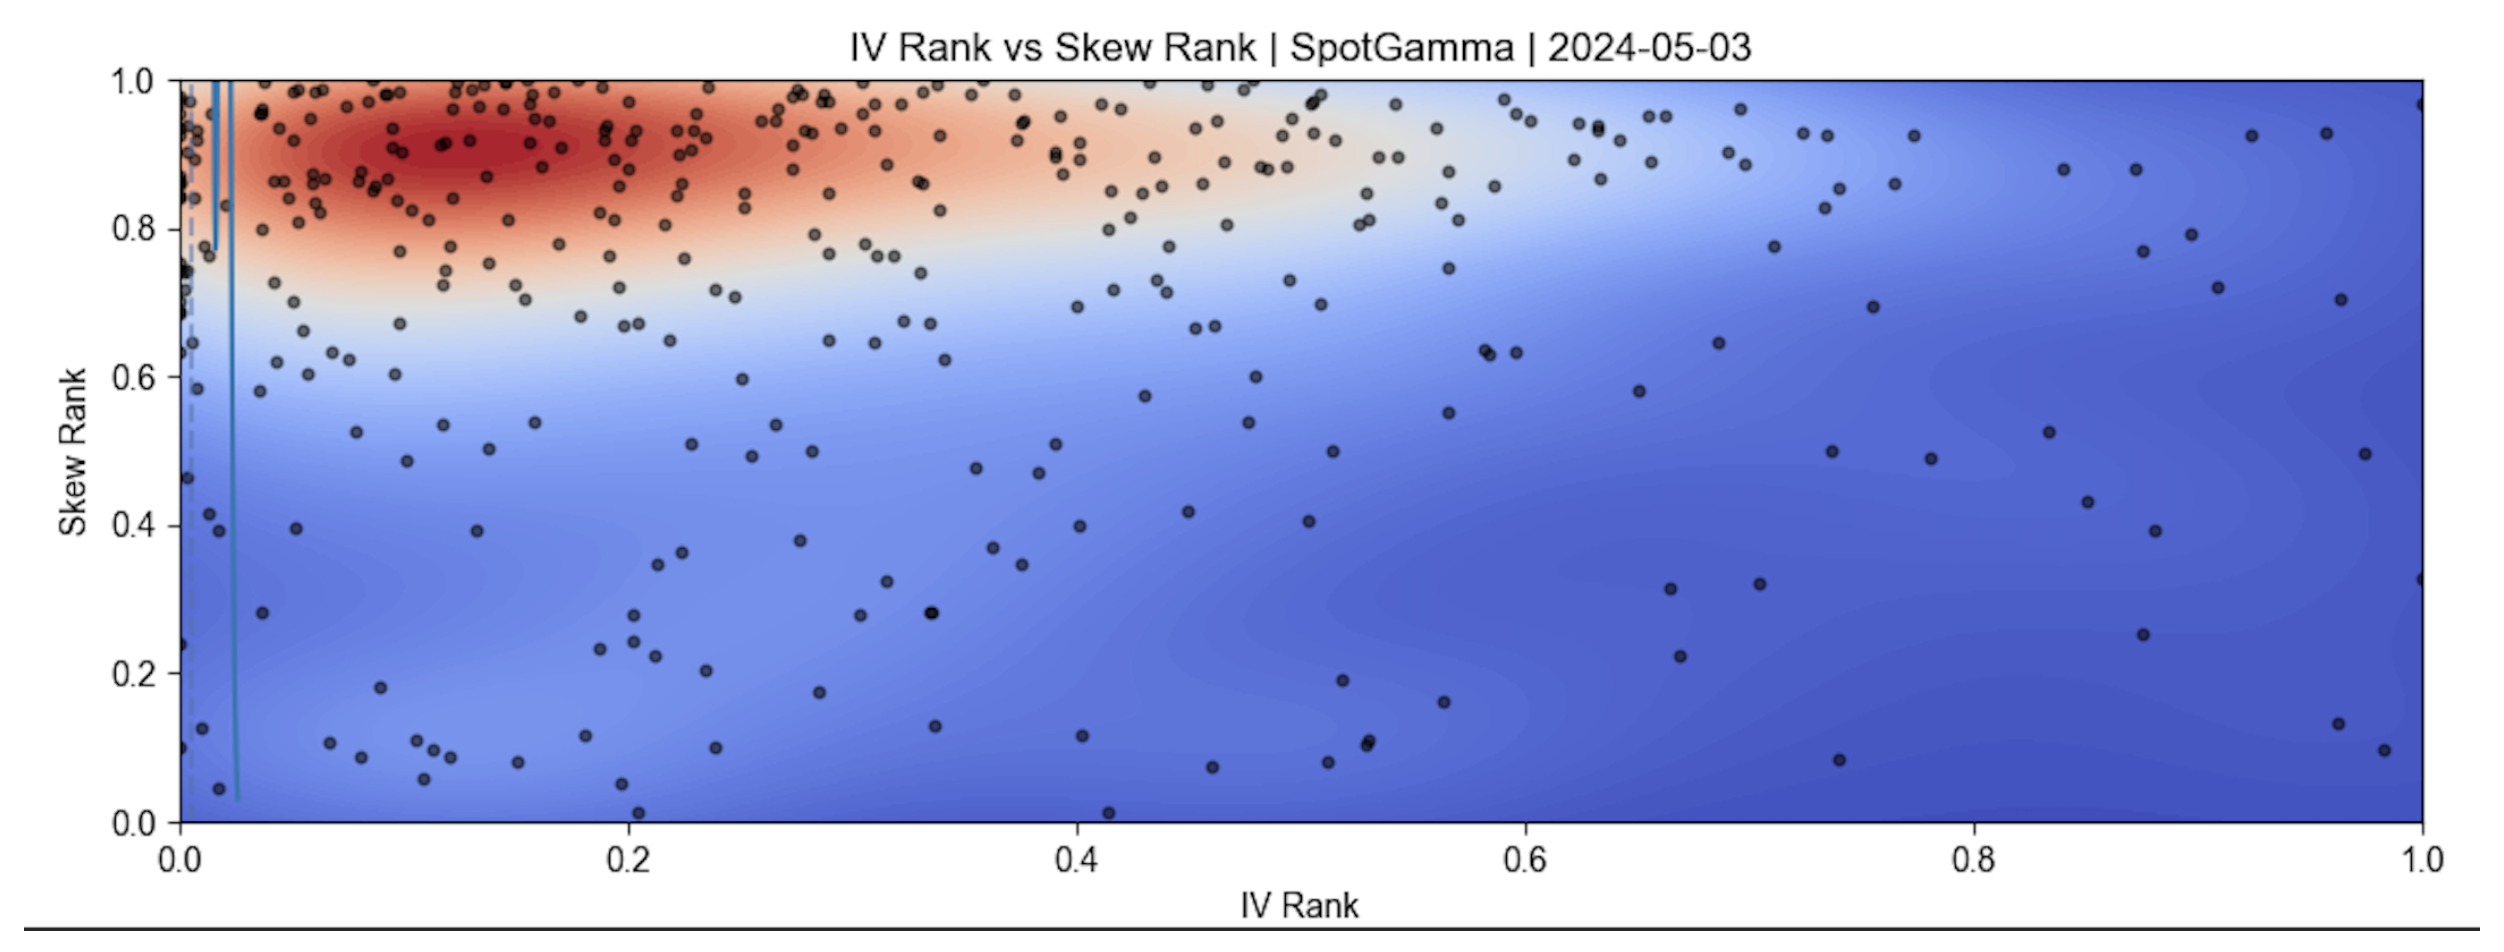
If we look more broadly at skews, we can see the red “blob” at the top left of this chart. This is starting to shift to “extreme” bullishness, as many stocks have increasing call IV’s relative to puts (i.e. skew, Y axis). IV Ranks are also sliding lower, which generally happens into bullish equity moves. A big NVDA number would likely shift us into extremes.
|
| /ES | SPX | SPY | NDX | QQQ | RUT | IWM |
|---|---|---|---|---|---|---|---|
| Reference Price: | $5331.98 | $5308 | $529 | $18596 | $452 | $2109 | $209 |
| SG Gamma Index™: |
| 3.387 | 0.051 |
|
|
|
|
| SG Implied 1-Day Move: | 0.58% | 0.58% | 0.58% |
|
|
|
|
| SG Implied 5-Day Move: | 1.95% | 1.95% |
|
|
|
|
|
| SG Volatility Trigger™: | $5218.98 | $5195 | $528 | $18090 | $439 | $2050 | $205 |
| Absolute Gamma Strike: | $5323.98 | $5300 | $530 | $18500 | $450 | $2100 | $210 |
| Call Wall: | $5323.98 | $5300 | $530 | $18600 | $460 | $2200 | $210 |
| Put Wall: | $5023.98 | $5000 | $510 | $18630 | $430 | $2000 | $200 |
| Zero Gamma Level: | $5221.98 | $5198 | $524 | $18135 | $442 | $2073 | $206 |
|
| SPX | SPY | NDX | QQQ | RUT | IWM |
|---|---|---|---|---|---|---|
| Gamma Tilt: | 1.518 | 1.056 | 1.852 | 1.728 | 1.194 | 1.208 |
| Gamma Notional (MM): | $1.347B | $713.077M | $18.343M | $1.249B | $25.862M | $576.881M |
| 25 Delta Risk Reversal: | -0.017 | 0.009 | -0.019 | 0.007 | -0.014 | -0.003 |
| Call Volume: | 828.577K | 1.709M | 15.069K | 1.252M | 34.904K | 408.076K |
| Put Volume: | 1.363M | 2.991M | 12.686K | 1.101M | 87.112K | 806.67K |
| Call Open Interest: | 7.29M | 6.108M | 65.444K | 4.473M | 324.661K | 4.405M |
| Put Open Interest: | 14.493M | 15.432M | 85.962K | 6.96M | 553.011K | 9.06M |
| Key Support & Resistance Strikes |
|---|
| SPX Levels: [5300, 5000, 5250, 5200] |
| SPY Levels: [530, 525, 529, 528] |
| NDX Levels: [18500, 18600, 18700, 18650] |
| QQQ Levels: [450, 453, 460, 440] |
| SPX Combos: [(5568,85.92), (5552,86.52), (5526,73.17), (5499,98.71), (5473,78.42), (5462,72.16), (5451,96.37), (5425,85.56), (5409,79.28), (5398,99.69), (5382,87.16), (5377,93.19), (5372,91.37), (5367,83.48), (5361,94.17), (5356,76.17), (5351,99.80), (5345,94.50), (5340,97.28), (5335,92.49), (5329,97.05), (5324,99.64), (5319,97.05), (5313,93.64), (5308,97.53), (5303,88.76), (5298,99.94), (5276,95.23), (5250,96.95), (5202,83.34), (5149,76.21), (5122,76.82), (5112,70.88), (5101,79.38), (5048,77.98)] |
| SPY Combos: [535.07, 530.3, 545.13, 525] |
| NDX Combos: [18894, 18597, 18690, 18485] |
| QQQ Combos: [456.94, 461.92, 460.11, 451.95] |
0 comentarios