Macro Theme:
Short Term SPX Resistance: 5,410
Short Term SPX Support: 5,300
SPX Risk Pivot Level: 5,300
Major SPX Range High/Resistance: 5,410
Major SPX Range Low/Support: 5,000
- NVDA 10-1 split Friday night has the potential for relative top the week of 6/10
- Upside scenario:
- 5,400 is major resistance into FOMC 6/12
- 5,500 is our target high for 6/21 OPEX, should CPI + FOMC meet expectations
- Downside scenario:
- A break of 5,300 likely leads to a test of 5,200
- <5,300 the market fully loses positive gamma support, allowing for higher implied volatility (i.e. VIX 20) and a move down into 5,000
- 5,000 is massive support into June OPEX 6/21 & June Quarterly OPEX 6/28
Founder’s Note:
ES futures are +10bps to 5,390. NQ futures are +15bps to 19,271.
Key SG levels for the SPX are:
- Support: 5,375, 5,360, 5,350, 5,311, 5,300
- Resistance: 5,388, 5,400, 5,410
- 1 Day Implied Range: 0.55%
For QQQ:
- Support: 462, 460
- Resistance: 470, 475
IWM:
- Support: 200, 195
- Resistance: 205, 210, 220
CPI 8:30 AM ET, FOMC 2PM.
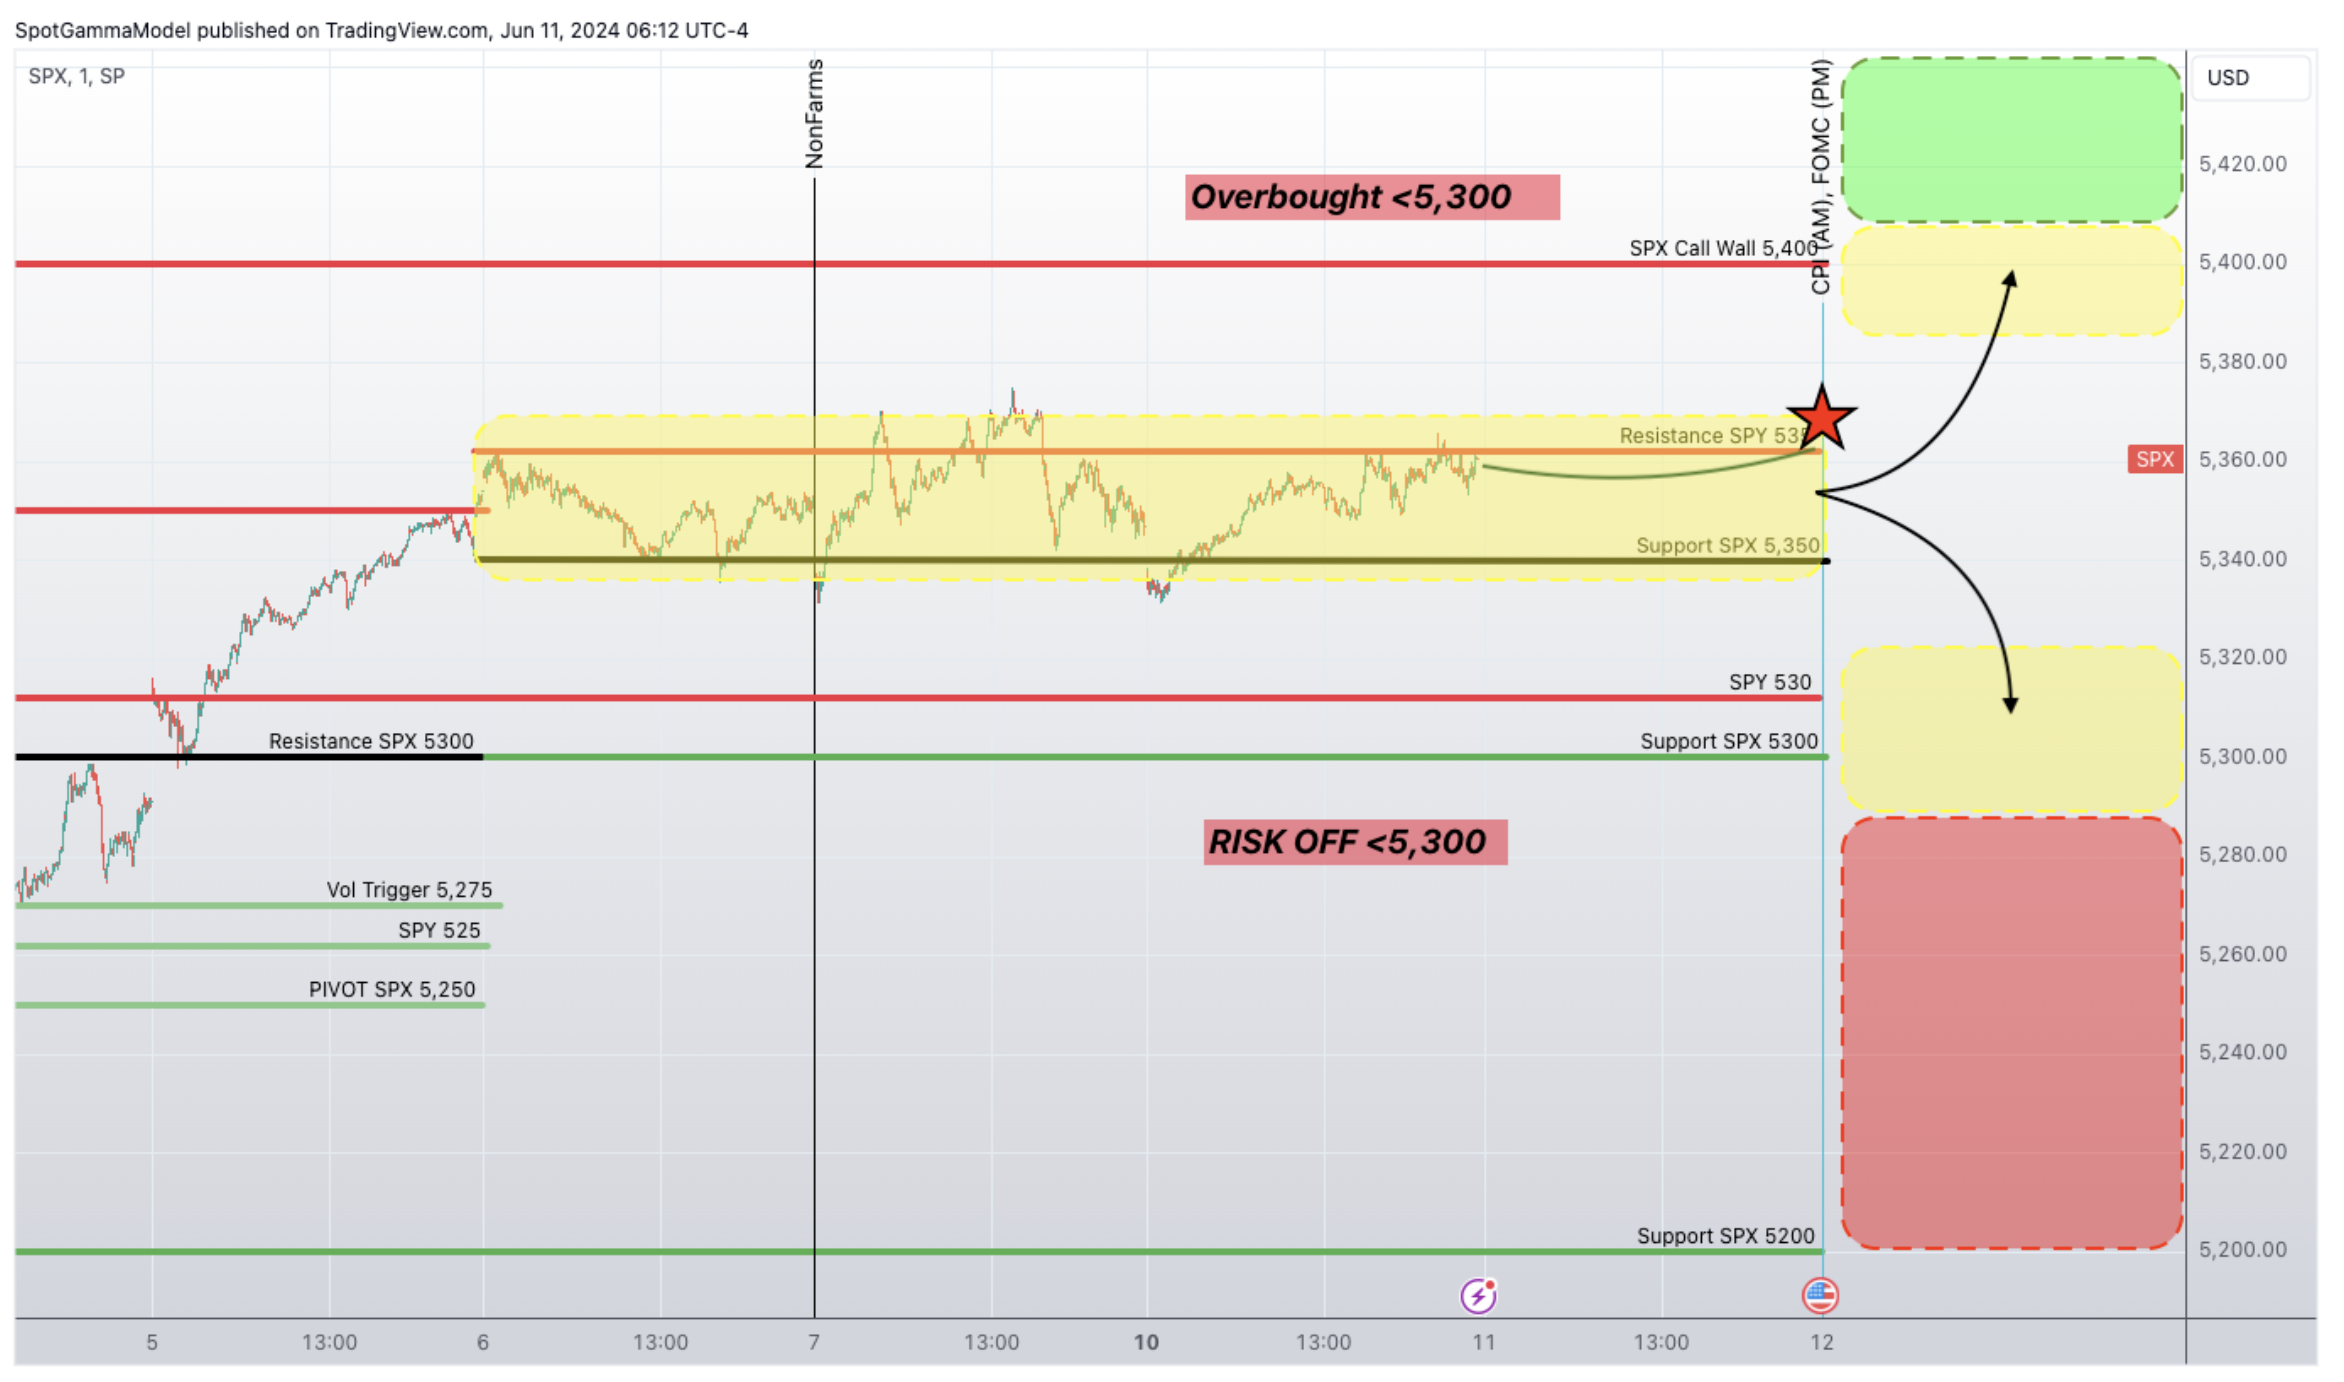
Yesterday’s 0DTE straddle was $20, or 37bps, and today’s straddle is a much larger $50 or 93bps (ref 5,380, IV 36%) due to CPI/FOMC. This means we are not likely holding that tight trading range from the last several days (yellow shaded range, below), as shown in the map we posted yesterday AM (seen below).
For today we see heavy resistance at 5,400- 5,410 (SPY 540), and we will mark that as the top of our range until/unless the
Call Walls
roll higher. In-line rate data today likely means the walls roll up tomorrow, and equities glide higher into June OPEX 5/21 with ~5,500 a likely OPEX high. Accordingly, we would look for implied volatility to contract significantly. Further, we would want to be mega-cap/semi stocks in this upside scenario, as they would likely significantly outperform due to large upside SPX positive gamma, which could stifle index volatility.
To the downside the major level is 5,300. We think that 5,300 is in play for today with a hot CPI number, and below that level our models flip to risk-off due to negative gamma.
Turning to implied volatility & the VIX, we yesterday discussed correlation, and its all-time lows (read here). 1-month historical vol in the SPX is ~8.5%, which equates to a “fair value” in the VIX of ~12, and the VIX is currently 13. With benign data today (i.e. rates don’t move up), we would expect the VIX to undershoot its fair value, and head toward 11.
We can frame this in the SPX IV space more directly, as at-the-money IV’s (shown in the term structure) would sync to year-to-date lows. This would be the term structure readings at or below the bottom of the shaded cone. IV’s dropping is vanna-fuel for a market rally, with most of that fuel being used up by weeks-end. This likely looks something like a big equity jump into the end of this week, with drift into a huge OPEX next week.
We are giving odds to this scenario (CPI in-line, FOMC non-event = equities higher) simply from the fact that generally these data points do not surprise, which leads to a drop in IV/event vol.
Conversely, the downside scenario at this point is less clear. There is major support at 5,300, and the SPX is now ~1.5% above that level. Therefore we could have a violent reaction today to 5,300, but then a supportive pause for traders to digest the updated data from FOMC. Its not until <5,300 that dealer hedging flows invoke a sustained jump in volatility.
This may look like this: If there is a big miss in CPI, we could quickly test 5,300, but we’d likely need a hawkish Powell to break <5,300.
In that “worst case” scenario <5,300 we would be eyeing 5,000 as major support for the week between June OPEX 6/21 & Quarterly OPEX 6/28.

0 comentarios