
Macro Theme:
Key dates ahead:
- 4/9: FOMC Mins
4/7: Into record high IV/VIX levels, we are looking at ways to play volatility contraction over the next 1-2 weeks via +2 month call spreads and/or flies, with a possible rally “resistance free” into the 5,400 zone. Such a rally could setup a shorting opportunity as downside pressure relatively subsides. To the downside, there are some large dealer positive gamma positions at 4,800, but that strike stands against the unwinding of massive global/cross asset flows which could overwhelm local options hedging. So – we tread lightly when trying to call price bottoms.
Key SG levels for the SPX are:
- Resistance: 5,000, 5,400
- Support: 4,800
Founder’s Note:
We wake up this AM to the VIX at 50.09, and equity futures off more than 2% (ES 4,980). That is well off overnight lows near -5% (ES 4,832)
This crash has “gone global: Chinese stocks, Nikkei & DAX were off 10%, with others seeing similar selling.
TLDR: We covered in Sunday Night’s note that the most interesting way to play this market may be through +2 month call spreads and or call flies, which seek to gain from high options decay/IV declining as well as from any possible market rally. We think that it is now, in the short term, too late to play downside. Does that mean the market can’t go lower? Of course not. But with VIX blowing out, it implies puts are too expensive to justify buying. The market knows this about hedging, but some hands are forced to hedge or liquidate. We think a new short opportunity may come after equity markets stage a sharp rally and VIX/IV contracts.
Second, there are only 2 key levels that may be large enough to stand out in this global/cross asset spasms: 4,800 (+$1bn large dealer long put) and 5,400 (big $1bn “Straddle” position). As we “zoom out” with our trading (i.e. not playing day trades) we are positioning around these levels as vol may “peak” and “trough” in these zones. Our last point here: there is enough vol and negative gamma to turbocharge any rally clear up into 5,400. This presents a right tail risk, as much as a left.
Just a few vol charts to put some of this into context:
SPX term structure is showing >100% IV for today…I can’t recall ever having seen that before. That 116% 0DTE IV equates to a $158 0DTE straddle (ref 4945). That sounds high, but the ES futures have realized that move 4 times overnight!
Note the odd “kink” in May – those options appear to be 0 bid @ 500 across the strip. In other words – the quotes are busted. This is a critical thing to note: don’t put yourself in a position wherein you need exit liquidity right here, right now, because markets often break under these conditions. We personally love trading these markets, and are focused on medium to longer dated positions.

1-month skew vs its 90-day range… incredible:

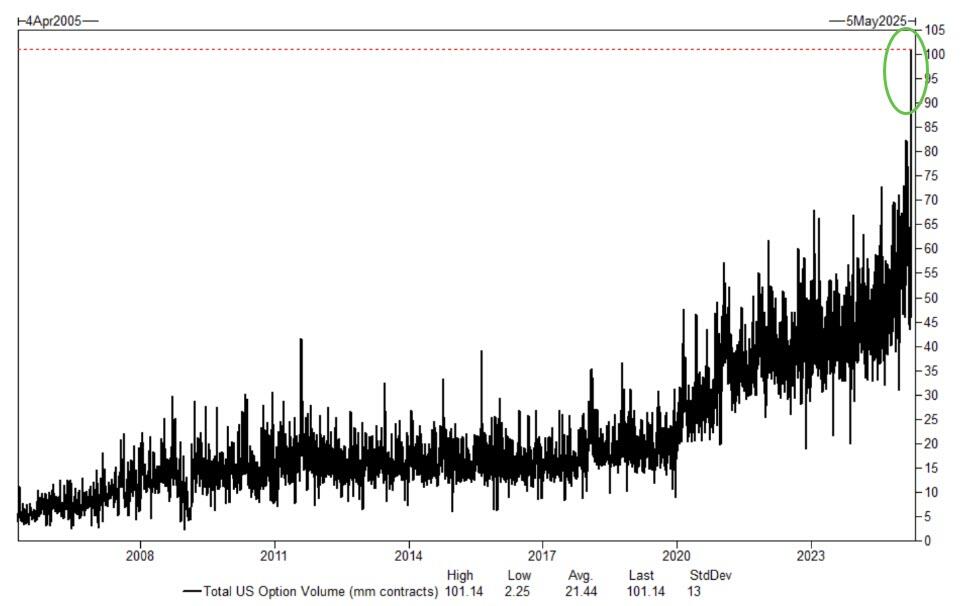
US options volume hit a record high on Friday (per GS):
Ok – let’s get on with it.
We’ve made this point a few times over the last few days: we are all vol traders today, not so much directional strategists. We read a lot of naive posts over the weekend about vanna and charm but lets be honest: every global asset/flow imaginable is sloshing around right now. Bring up your favorite currency pair, bond chart, or take a look at credit spreads. All show a lot of volatility. If/when there is some positive news, volatility should contract and that can invoke a lot of options flows, but we think those flows need a macro trigger to unlock.
This means that we are today going to be watching the options market more through the lens of sentiment & behavior, as opposed to flows.
For example, under more normal conditions we target specific strikes, or tight positive gamma ranges, as areas wherein options dealer flows are likely to invoke control over the equity market. For example: “There is positive gamma at XYZ strike, and so dealers will support the market there.” 99.999% of the time we would use such a statement to navigate markets – but in this case the interim flows from some carry-trade gone awry or credit hedging program could dominate short term behaviors, overpowering options flows. For today, we are only looking at the biggest of options strikes as meaningful: in this case 4,800 and 5,400(+$1bn positions).
Additionally, options market makers widen their quotes WAY out in these environments. This pads their PNL, allowing them to possibly reduce or alter their hedging flows. For example, if I can see you a $100 strike put for $100 – well I have no need to hedge that!
Now, if we were at an OPEX, then the clearing of a massive amount of options positions all at once could be a trigger to positions options a the main market driver. The closest opportunity for that is next week (4/17 OPEX).
That does NOT mean there is no signal or value in the options data, its just that we need to focus much more heavily on sentiment & volatility signals through
HIRO
& IV/VIX.
Specifically we are watching options flows to understand when traders are “finding value” through short and long positioning. Second, from a trading standpoint, options prices are getting to very, very extreme values. These extreme values are almost always born from forced trading: for example: if you own bonds on ABC co and you think they could default, well you buy the ABC equity puts because equities are lower in the capital structure (i.e. they go to 0 before bonds). We think these extremes can present excellent risk/reward options trades.
With all of that being said, lets break down positioning.
The SPX is seeing some net positive gamma <=5,000, with one particularly large fund short put (dealer long) at 4,800, with $1bn of gamma. The lack of fund traders net long puts (i.e. dealers short gamma) in this area is a general signal that large funds find “value” in this SPX price area, and so we would look to play volatility contraction (i.e. “peak VIX”) if the SPX visits this level via, for example, +2 month short volatility options structures (we can discuss at 1PM ET). Again, as options traders we view this area as a possible “peak IV/VIX” region.
If you are a futures trader, this means that we would only be tactically buying/selling only if there was clearly large options buying/selling via
HIRO,
and the VIX/implied volatility is coming down/up. We want to see those delta/HIRO flows & corresponding VIX movement as the leading indicator vs first looking specific gamma strike as the buy or sell support strike/zone.
Simplified, for swing traders: If
HIRO
is tanking/ripping, and the VIX is spiking/dropping, we would favor leaning short/long the market, irrespective of a specific gamma level.

As options traders, if you want to start looking for trading opportunities we love the Fixed Strike matrix set to “skew premium” mode. Below is the SPX, and as you can see there is a wide bright green band that frames where skew premium is richest. These are generally the 15-25 delta puts for each expiration out in time. We are not suggesting to go out and sell naked puts at these strikes, but we do calculate these strikes as having the most vol premium. On this point, Compass shows us that its put skews that are unsurprisingly blowing out, and that call skew is pretty flat.
We have discussed why we think call spreads and/or flies are more interesting, because, while the relative IVs are a bit lower, they limit some downside market risks. For example, our math says that ~15-20 delta calls may lose value if the SPX rallies 5-10% and IV contracts. Make sure to do your own due diligence on this statement, but its a path worth investigating.

|
| /ES | SPX | SPY | NDX | QQQ | RUT | IWM |
|---|---|---|---|---|---|---|---|
| Reference Price: | $5108.47 | $5074 | $505 | $17397 | $423 | $1827 | $181 |
| SG Gamma Index™: |
| -2.953 | -0.556 |
|
|
|
|
| SG Implied 1-Day Move: | 0.82% | 0.82% | 0.82% |
|
|
|
|
| SG Implied 5-Day Move: | 1.95% | 1.95% |
|
|
|
|
|
| SG Implied 1-Day Move High: | After open | After open | After open |
|
|
|
|
| SG Implied 1-Day Move Low: | After open | After open | After open |
|
|
|
|
| SG Volatility Trigger™: | $5859.47 | $5825 | $571 | $19500 | $480 | $2000 | $220 |
| Absolute Gamma Strike: | $5034.47 | $5000 | $550 | $19600 | $450 | $2000 | $190 |
| Call Wall: | $5424.47 | $5390 | $600 | $19600 | $500 | $1940 | $230 |
| Put Wall: | $5034.47 | $5000 | $500 | $17000 | $425 | $1800 | $190 |
| Zero Gamma Level: | $5810.47 | $5776 | $556 | $18710 | $466 | $2010 | $199 |
|
| SPX | SPY | NDX | QQQ | RUT | IWM |
|---|---|---|---|---|---|---|
| Gamma Tilt: | 0.475 | 0.320 | 0.605 | 0.489 | 0.411 | 0.261 |
| Gamma Notional (MM): | ‑$1.243B | ‑$2.162B | ‑$10.328M | ‑$794.974M | ‑$47.608M | ‑$1.224B |
| 25 Delta Risk Reversal: | -0.127 | 0.00 | -0.205 | -0.085 | -0.111 | -0.092 |
| Call Volume: | 869.967K | 2.78M | 12.573K | 1.419M | 43.798K | 682.429K |
| Put Volume: | 2.393M | 5.995M | 13.902K | 1.82M | 88.704K | 2.081M |
| Call Open Interest: | 7.116M | 6.994M | 66.596K | 3.682M | 266.60K | 3.646M |
| Put Open Interest: | 12.148M | 11.198M | 70.955K | 5.284M | 401.72K | 7.859M |
| Key Support & Resistance Strikes |
|---|
| SPX Levels: [5000, 6000, 5400, 4000] |
| SPY Levels: [550, 540, 530, 525] |
| NDX Levels: [19600, 18000, 19500, 20000] |
| QQQ Levels: [450, 470, 440, 460] |
| SPX Combos: [(5313,75.51), (5302,90.93), (5272,73.75), (5252,83.75), (5226,72.37), (5221,68.20), (5201,95.87), (5170,70.19), (5150,86.07), (5120,77.11), (5099,95.81), (5049,81.91), (5018,77.80), (5003,97.17), (4952,84.14), (4917,73.62), (4902,95.09), (4851,87.86)] |
| SPY Combos: [537.24, 527.04, 517.38, 546.9] |
| NDX Combos: [17467, 17259, 18094, 17676] |
| QQQ Combos: [450.21, 439.84, 444.8, 464.63] |
0 comentarios