
Macro Theme:
Key dates ahead:
- 4/9: FOMC Mins
4/7: Into record high IV/VIX levels, we are looking at ways to play volatility contraction over the next 1-2 weeks via +2 month call spreads and/or flies, with a possible rally “resistance free” into the 5,400 zone. Such a rally could setup a shorting opportunity as downside pressure relatively subsides. To the downside, there are some large dealer positive gamma positions at 4,800, but that strike stands against the unwinding of massive global/cross asset flows which could overwhelm local options hedging. So – we tread lightly when trying to call price bottoms.
Key SG levels for the SPX are:
- Resistance: 5,000, 5,400
- Support: 4,800
Founder’s Note:
Futures are 1.3% higher this AM, which no material developments overnight.
From a GEX strike level, only 2 key levels stand out with significance: 4,800 support & 5,400 resistance. Given the large cross-asset flows prevalent in todays environment, those are the only two strikes which we view as “options dominated” ($2-3bn gamma per strike).

What is more critical here is to monitor volatility & flow. Specifically, with volatility, we want to see signals that traders are starting to sell their put options/long vix positions – and this can be closing their current hedges or shorting vol.
This is SPX fixed strike vol for this morning vs Friday night, and we see fixed strike vol is mildly higher across the board. This suggests that, despite the market rally, traders are maintaining a long volatility stance. This places any rally into the “speculative” bucket, meaning we are at risk of sharp and nasty reversals. If/when fixed strike vol starts to collapse, particularly on the put wing, that will be a strong signal that the rally has some longevity.

As we noted last night, the other key flow is to see how traders are active in the options single stock space. There was indeed some longer dated put selling in top single stocks last night, but it was mild (i.e. within the 30 day range). We also see that many top US stocks are “oversold” on their GEX charts, meaning there are no real put positions below current prices.
Consider, NVDA, which traded down to $86.6 yesterday. There is essentially no gamma below 85. Granted, 85 dealer short put is big, but where are the folks betting on another 10-20% downside? They don’t seem to exist. In a normal environment we’d be suggesting bullish positions in NVDA near that level (stock is $97 premarket), but this environment is one of 100% “macro” risk, and high equity correlations reflect that. Its not yet a stock pickers environment, but we think this story could change as soon as deals start getting signed.

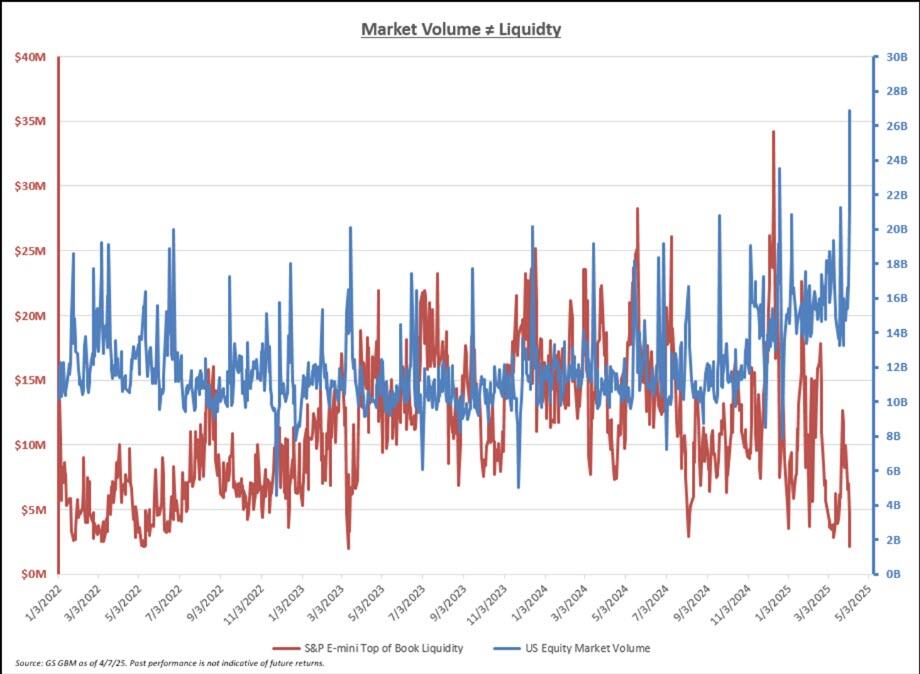
As we have harped on recently, liquidity is also trash. This presents more risk, on both tails, and liquidity probably doesn’t improve until the VIX comes back in <=35 (that goes for ES/stock liquidity, too). Here we have ES liquidity from GS/ZH plotted against stock volume, and you can see the inherent issue – record stock volume pouring into basement-level liquidity:
As far as our trading stance goes, we continue to favor selling +2 month deep <20 delta calls/call spreads. Call skews are actually quite low based on the Compass scanner, suggesting call spreads may be a better alternative to call flies. Critically, do your own work on these trades before you execute – as prices are changing rapidly. Second, as yesterday’s 8% 7-minute rally showed, going into short dated options is not our recommendation here, as it is not for the faint of heart.
We continue to like selling these medium to long term upside calls/call spreads as if the market rallies we believe vol will come in, and the time decay is very high when IV’s are high. Selling puts/put spreads is obviously another way to play this, but the risk is larger if stocks drop as you lose both on the delta component, and with the corresponding vol spike.

|
| /ES | SPX | SPY | NDX | QQQ | RUT | IWM |
|---|---|---|---|---|---|---|---|
| Reference Price: | $5107.9 | $5074 | $504 | $17397 | $423 | $1827 | $179 |
| SG Gamma Index™: |
| -2.957 | -0.512 |
|
|
|
|
| SG Implied 1-Day Move: | 0.99% | 0.99% | 0.99% |
|
|
|
|
| SG Implied 5-Day Move: | 1.95% | 1.95% |
|
|
|
|
|
| SG Implied 1-Day Move High: | After open | After open | After open |
|
|
|
|
| SG Implied 1-Day Move Low: | After open | After open | After open |
|
|
|
|
| SG Volatility Trigger™: | $5858.9 | $5825 | $570 | $19500 | $480 | $2000 | $220 |
| Absolute Gamma Strike: | $5033.9 | $5000 | $530 | $18000 | $450 | $2000 | $190 |
| Call Wall: | $6033.9 | $6000 | $650 | $19600 | $500 | $2055 | $230 |
| Put Wall: | $4733.9 | $4700 | $490 | $18000 | $390 | $1800 | $190 |
| Zero Gamma Level: | $5809.9 | $5776 | $555 | $18430 | $466 | $2010 | $198 |
|
| SPX | SPY | NDX | QQQ | RUT | IWM |
|---|---|---|---|---|---|---|
| Gamma Tilt: | 0.460 | 0.319 | 0.591 | 0.429 | 0.418 | 0.262 |
| Gamma Notional (MM): | ‑$1.121B | ‑$1.866B | ‑$5.161M | ‑$644.515M | ‑$41.392M | ‑$1.156B |
| 25 Delta Risk Reversal: | -0.148 | 0.00 | -0.072 | 0.00 | 0.00 | -0.119 |
| Call Volume: | 689.729K | 1.956M | 10.291K | 1.096M | 32.612K | 453.958K |
| Put Volume: | 2.099M | 3.422M | 10.284K | 1.18M | 50.403K | 967.411K |
| Call Open Interest: | 7.192M | 7.223M | 68.159K | 3.824M | 266.902K | 3.742M |
| Put Open Interest: | 12.473M | 11.442M | 65.74K | 5.441M | 408.103K | 8.074M |
| Key Support & Resistance Strikes |
|---|
| SPX Levels: [5000, 4000, 6000, 5500] |
| SPY Levels: [530, 550, 540, 525] |
| NDX Levels: [18000, 19600, 19500, 16000] |
| QQQ Levels: [450, 430, 425, 420] |
| SPX Combos: [(5323,77.56), (5313,87.54), (5262,78.42), (5211,93.79), (5160,79.73), (5110,92.05), (5064,72.20), (5028,71.18), (5013,94.94), (4962,82.40), (4927,72.13), (4912,95.39), (4861,88.20), (4831,70.66)] |
| SPY Combos: [498.43, 518.15, 508.04, 488.32] |
| NDX Combos: [17241, 17450, 16841, 17659] |
| QQQ Combos: [424.94, 419.86, 440.18, 430.02] |
0 comentarios