Futures are flat at 3830 as traders await the 8:30 AM ET Nonfarms print. This data release should drive some early volatility, with options traders pricing an ~1.5% SPX move on the day.
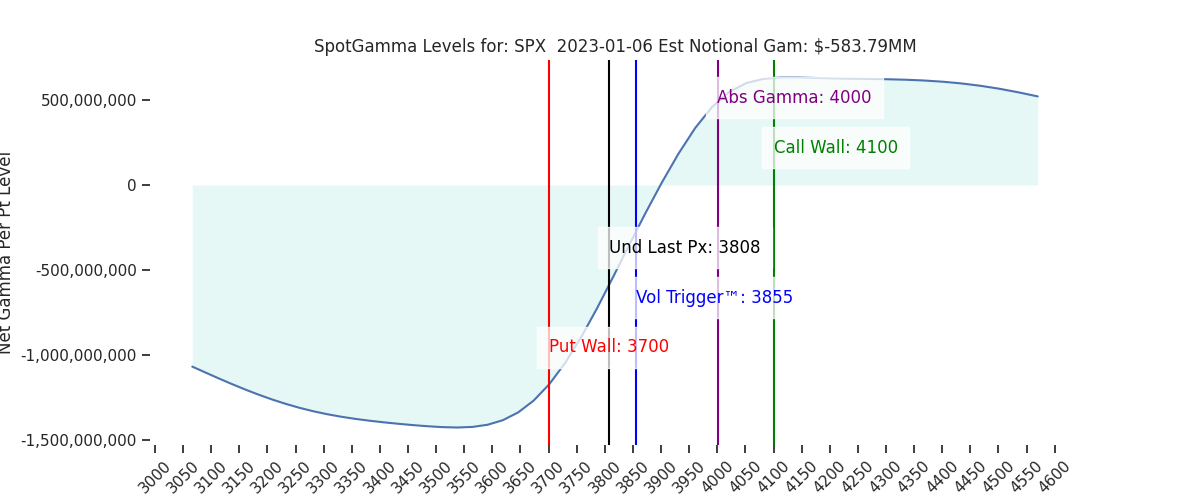
There were a few small changes to SG levels, namely the shift down in both SPY/SPX Put Walls to 370/3700 from 380/3800. Put Walls rolling to lower strikes is generally a bearish indicator. 3800 remains first, large support, however we now view more downside risk as a result of this Put Wall shift. On a break of 3800 we would anticipate a test of 3760 (SPY 375). Resistance above remains at 3850-3860, with 3900 above there.
Price action today will certainly be led by reaction to the Nonfarms data, but options traders seem to have now positioned to accept lower SPX prices. For the last several weeks traders have been able to use 3800 as a reliable support line, however the data now suggests 3800 is vulnerable. As a result, should we see 3800 break we would anticipate a test of the 375 SPY level (~3760 SPX). Conversely, the 3850-3860 is, for today, a strong resistance point for any upside surprise.
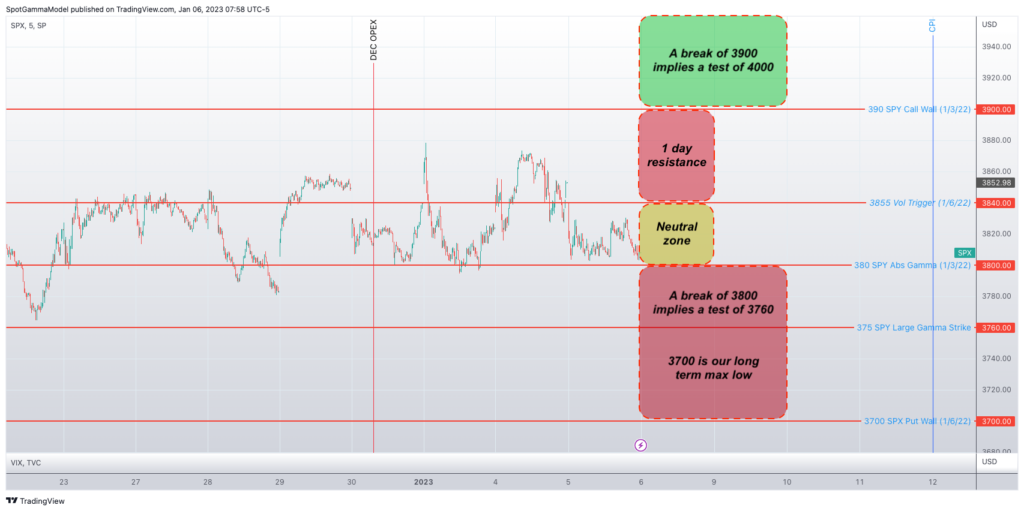
We have been looking for a strong rally this month, catalyzed by OPEX flows. That scenario is only in play if/when the S&P can regain 3900. As the SPX is currently near 3800, it would likely take 2-3 sessions to build up into 3900, and the SPX staging at that level is our signal to consider bullish trades.
However, as we are now nearing the heavily-watched 1/12 CPI number, we think the rally scenario is on hold until then.
Conversely a break to the downside here is more likely to be accepted as prices slip towards 3750, which could result in 3800 becoming near term overhead resistance. Said another way: markets have been primarily trading in the 3800-3850 range (as seen in the chart above), but a break lower today may have us looking at an effective range of 3750-3800 into Monday.
| SpotGamma Proprietary SPX Levels | Latest Data | SPX Previous | SPY | NDX | QQQ |
|---|---|---|---|---|---|
| Ref Price: | 3808 | 3827 | 379 | 10741 | 261 |
| SG Implied 1-Day Move:: | 1.23%, | (±pts): 47.0 | VIX 1 Day Impl. Move:1.42% | ||
| SG Implied 5-Day Move: | 2.89% | 3839 (Monday Ref Price) | Range: 3729.0 | 3951.0 | ||
| SpotGamma Gamma Index™: | -1.02 | -0.42 | -0.28 | 0.01 | -0.10 |
| Volatility Trigger™: | 3855 | 3845 | 380 | 11225 | 265 |
| SpotGamma Absolute Gamma Strike: | 4000 | 4000 | 380 | 11275 | 265 |
| Gamma Notional(MM): | -584.0 | -507.0 | -1449.0 | 1.0 | -672.0 |
| Put Wall: | 3700 | 3800 | 370 | 10500 | 260 |
| Call Wall : | 4100 | 4000 | 390 | 11275 | 271 |
| Additional Key Levels | Latest Data | Previous | SPY | NDX | QQQ |
|---|---|---|---|---|---|
| Zero Gamma Level: | 3897 | 3917 | 390.0 | 10658.0 | 300 |
| CP Gam Tilt: | 0.72 | 0.74 | 0.59 | 1.09 | 0.59 |
| Delta Neutral Px: | 3921 | ||||
| Net Delta(MM): | $1,445,413 | $1,417,924 | $151,045 | $39,666 | $81,615 |
| 25D Risk Reversal | -0.04 | -0.04 | -0.04 | -0.04 | -0.04 |
| Call Volume | 483,529 | 531,139 | 1,927,411 | 6,037 | 623,099 |
| Put Volume | 702,224 | 912,265 | 2,401,393 | 8,111 | 1,039,772 |
| Call Open Interest | 5,608,204 | 5,526,643 | 6,523,842 | 62,370 | 4,732,989 |
| Put Open Interest | 9,957,883 | 9,833,261 | 11,358,798 | 55,080 | 6,057,146 |
| Key Support & Resistance Strikes: |
|---|
| SPX: [4000, 3900, 3850, 3800] |
| SPY: [390, 385, 380, 375] |
| QQQ: [280, 270, 265, 260] |
| NDX:[12000, 11500, 11275, 11000] |
| SPX Combo (strike, %ile): [(3812.0, 81.29), (3801.0, 95.77), (3774.0, 85.98), (3763.0, 77.97), (3755.0, 75.28), (3751.0, 95.15), (3728.0, 78.91), (3724.0, 87.34), (3713.0, 81.66), (3702.0, 97.06), (3675.0, 81.91), (3648.0, 90.3)] |
| SPY Combo: [368.76, 378.62, 373.69, 363.45, 371.03] |
| NDX Combo: [10677.0, 10269.0, 10473.0, 10881.0] |