
Futures are holding steady overnight, near 3985. This morning we have the highly anticipated CPI, with todays ATM SPX straddle priced at $84 (ref 3970, IV=75%). On the initial CPI reaction the two major levels we in play are 4063-4076 (combo strikes) to the upside and 3900 to the downside. Following that initial reaction the major levels we are targeting into early next week are 410 SPY (Call Wall) or 3800 (SPX/SPY Put Walls) to the downside.
We’ve mapped out the key zones below. Once again markets have put together a big rally into the major catalyst, with the S&P +4% since Fridays open. The SPX is now staged just under the neutral zone of the huge 4000 gamma strike, which is also the heavily watched 200 day MA. Bulls need a close above 4000 today, without that the bull bet is likely off, and 4000 becomes major resistance into next week.
Our general view is that a dovish print generates a strong upside response into 4050-4100 over the next 1-2 sessions, but that upside movement turns into more of a grind if markets are as we approach next weeks OPEX. 410 SPY is our market top until/unless the Call Wall shifts up. Additionally in the chart below you can see that we have had two “upside surprises” in December (driven by Powell/CPI) that both stalled in the 4075 area. We think its likely this 4% pre-CPI rally likely pulled forward some of the upside momentum on a CPI beat.
As a result of this resistance area into 410SPY, traders may find more success long select single stock calls in this scenario, particularly those beaten up tech names which likely have more negative gamma punch (ex: GOOGL/AAPL/TSLA).
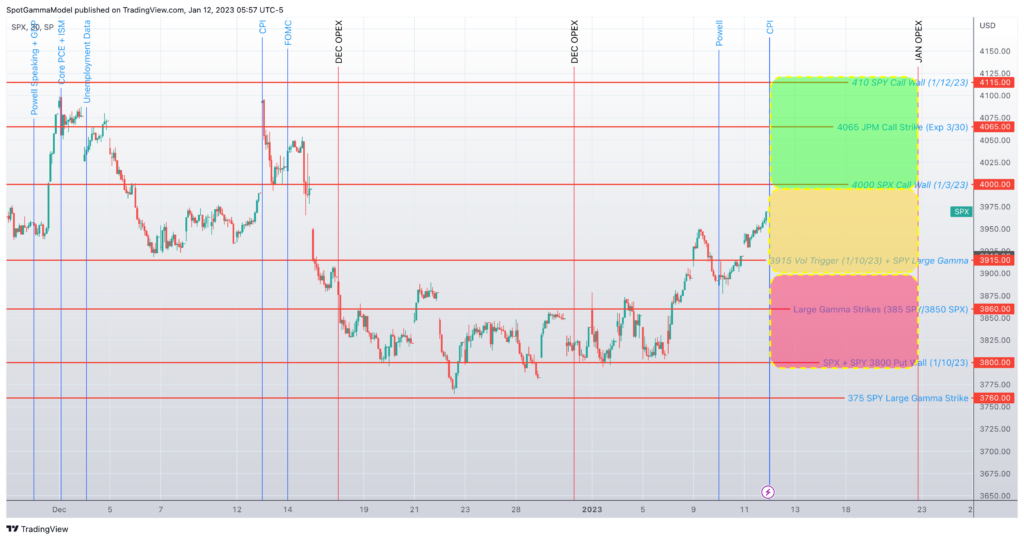
The downside is more dynamic. While 3900 is the “first stop” on a bearish print, 3800 is the larger stop over the next 1-2 sessions, and that likely keeps markets much more volatile into next week. This is because put positions return to being the dominant force on a move <3900, and along with that, negative gamma and higher volatility.
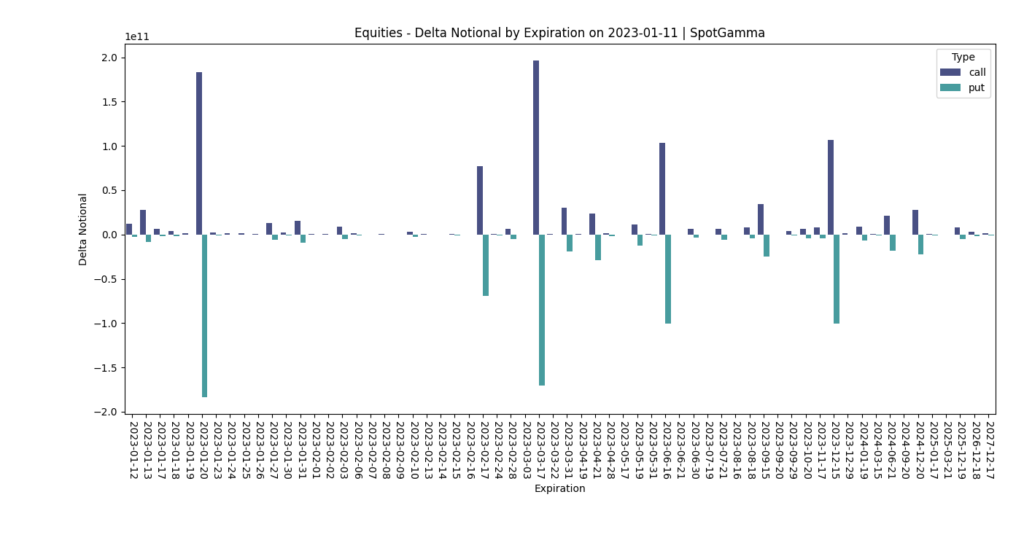
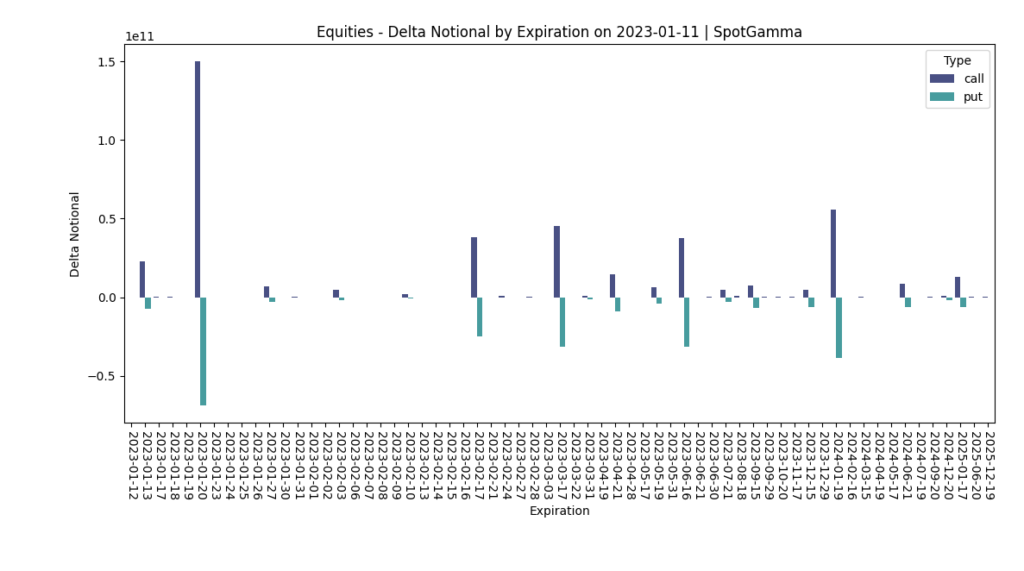
On this overall point, what was a put-heavy Jan OPEX has now become more call-weighted in single stocks (left), and very neutral in indexes (right). The key takeaway is that next weeks Jan OPEX is not a major upside catalyst here (it would be if these positions were more put-weighted).
| SpotGamma Proprietary SPX Levels | Latest Data | SPX Previous | SPY | NDX | QQQ |
|---|---|---|---|---|---|
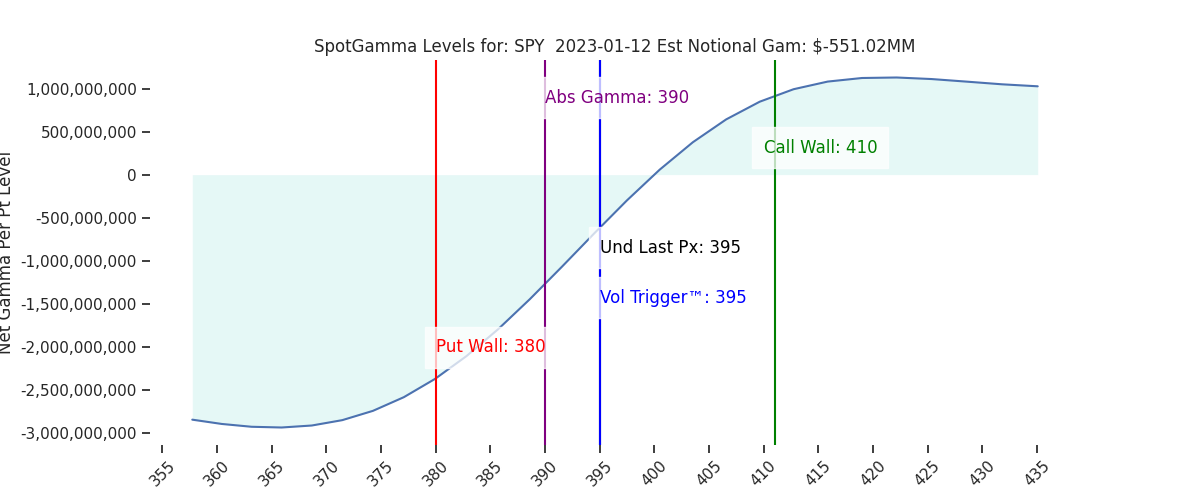
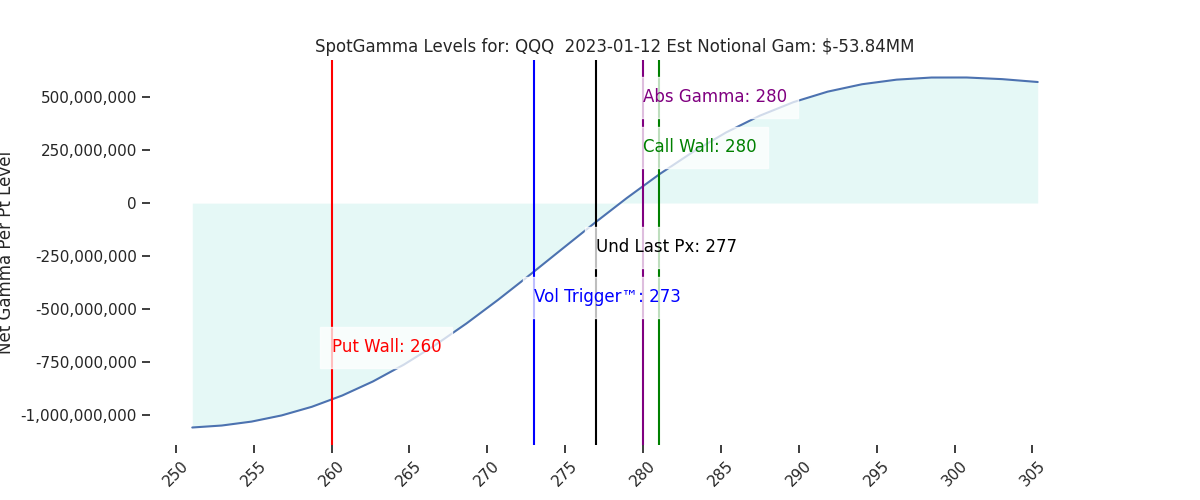
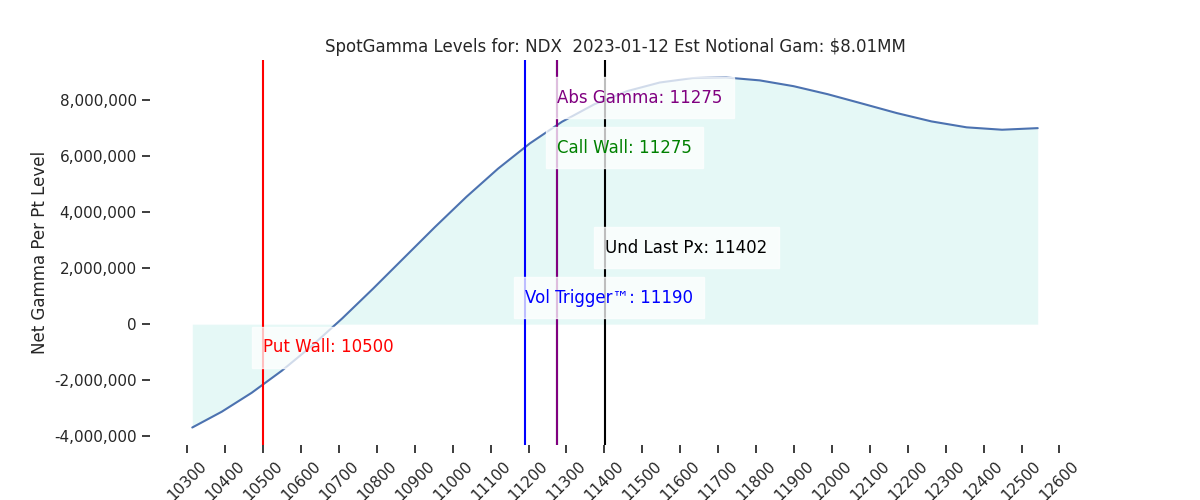
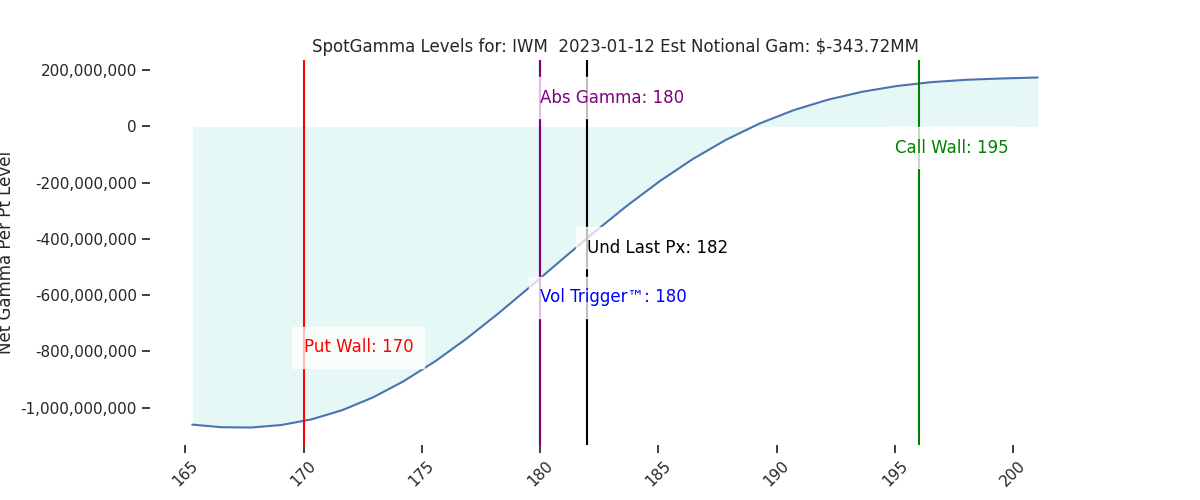
| Ref Price: | 3969 | 3955 | 395 | 11402 | 277 |
| SG Implied 1-Day Move:: | 1.15%, | (±pts): 46.0 | VIX 1 Day Impl. Move:1.33% | ||
| SG Implied 5-Day Move: | 3.0% | 3894 (Monday Ref Price) | Range: 3777.0 | 4011.0 | ||
| SpotGamma Gamma Index™: | 0.57 | 0.14 | -0.11 | 0.05 | -0.00 |
| Volatility Trigger™: | 3915 | 3910 | 395 | 11190 | 273 |
| SpotGamma Absolute Gamma Strike: | 4000 | 4000 | 390 | 11275 | 280 |
| Gamma Notional(MM): | 134.0 | 253.0 | -551.0 | 8.0 | -54.0 |
| Put Wall: | 3800 | 3800 | 380 | 10500 | 260 |
| Call Wall : | 4000 | 4000 | 410 | 11275 | 280 |
| Additional Key Levels | Latest Data | Previous | SPY | NDX | QQQ |
|---|---|---|---|---|---|
| Zero Gamma Level: | 3971 | 3928 | 397.0 | 10653.0 | 302 |
| CP Gam Tilt: | 1.17 | 1.15 | 0.83 | 1.72 | 0.97 |
| Delta Neutral Px: | 3936 | ||||
| Net Delta(MM): | $1,546,812 | $1,502,850 | $161,334 | $49,278 | $86,050 |
| 25D Risk Reversal | -0.04 | -0.04 | -0.04 | -0.04 | -0.04 |
| Call Volume | 624,412 | 477,078 | 1,827,522 | 9,329 | 1,026,994 |
| Put Volume | 919,804 | 775,697 | 3,089,669 | 9,126 | 1,115,677 |
| Call Open Interest | 5,845,956 | 5,762,785 | 6,813,753 | 67,915 | 4,983,063 |
| Put Open Interest | 10,387,937 | 10,189,975 | 12,726,959 | 60,494 | 6,660,952 |
| Key Support & Resistance Strikes: |
|---|
| SPX: [4000, 3950, 3900, 3850] |
| SPY: [400, 395, 390, 380] |
| QQQ: [285, 280, 270, 265] |
| NDX:[12000, 11500, 11275, 11000] |
| SPX Combo (strike, %ile): [(4148.0, 85.24), (4100.0, 95.88), (4076.0, 91.3), (4064.0, 89.3), (4049.0, 93.03), (4033.0, 75.46), (4029.0, 82.95), (4025.0, 89.02), (4013.0, 75.28), (4001.0, 98.08), (3973.0, 84.4), (3949.0, 79.9), (3850.0, 85.29), (3814.0, 86.06), (3798.0, 93.08)] |
| SPY Combo: [398.68, 408.57, 378.51, 403.43, 406.2] |
| NDX Combo: [11277.0, 10889.0, 11505.0, 11916.0, 11710.0] |
0 comentarios