Consumer price data came in as expected, and this resulted in some dovish price action.
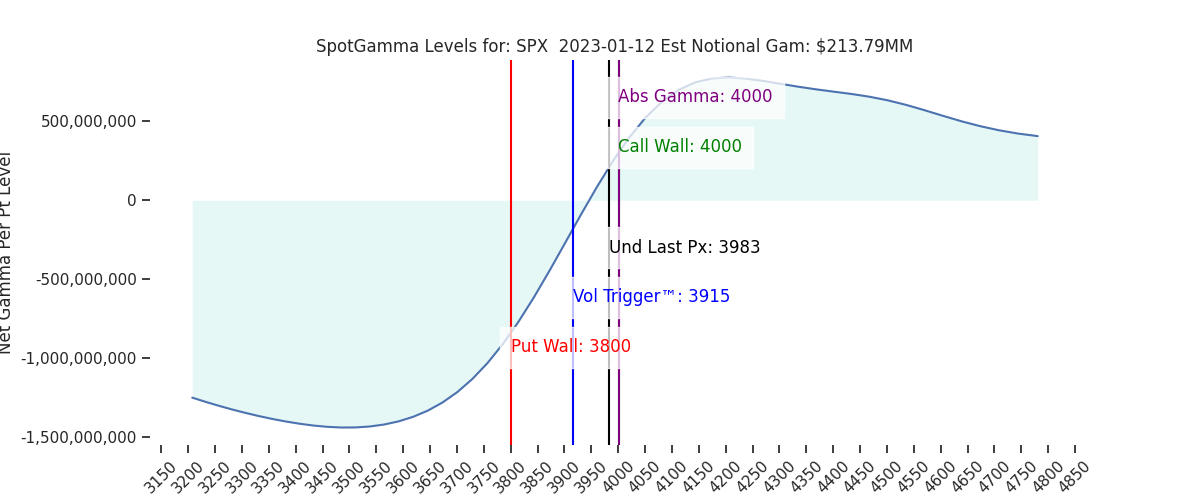
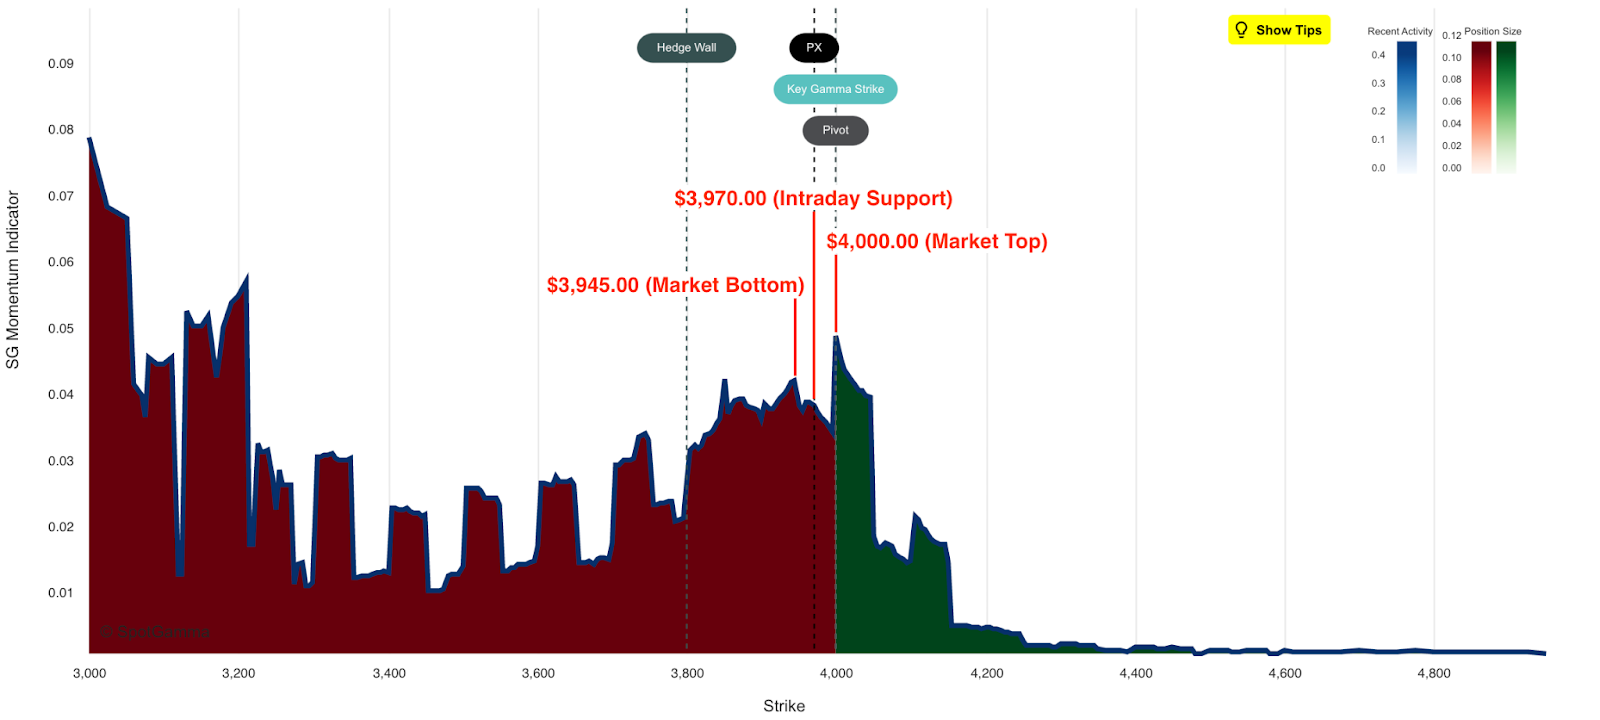
The S&P 500 (INEX: SPX), after a volatile first hour, ended the day higher, short of our $4,000.00 Call Wall. Note that this was a level we said the index was likely to reach after Tuesday’s break above our $3,900.00 Volatility Trigger (bull/bear pivot). Beyond the $4,000.00 figure, $3,945.00 and $3,970.00 were held as major supports, today. We retrieved these levels via our Equity Hub tool.
Note: Inflections in the below chart of our Equity Hub often serve as important turning points.
After the market opened, there was a large decline in top-line measures of implied volatility (IV) such as the VIX. As we discussed, ahead of consumer price updates, traders sought protection or options, and this resulted in higher IV.
Short of anything unexpected, traders were expected to sell volatility after consumer price updates, which they did; consumer price data met expectations and traders sold their options which added a boost (i.e., delta hedging blows with respect to falling IV or bullish vanna flows).
In the AM Note, we quoted the 0 DTE at-the-money SPX straddle at $84.00 (reference: $3,970.00, IV = 75%). At the close, the straddle was priced at ~$13.00. Short volatility turned out to be a great trade, as we expected.
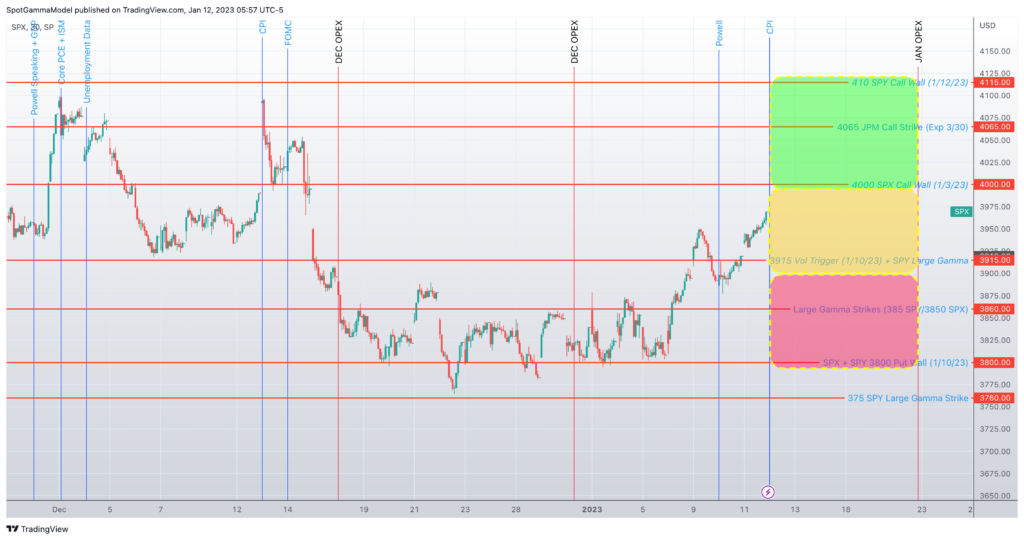
We think the bullishness that was to boost the SPX into OPEX was spent. Bulls’ inability to close the SPX above $4,000.00 likely results in less bullishness over the coming days. Therefore, we think the $4,000.00-$4,100.00 area resists a far-reaching advance.
Traders may find more opportunities in depressed single stocks (e.g., Apple, Google, and Tesla). We say this in a nod to our post on the SPX up, VIX up phenomenon; traders’ fear of missing out on upside may result in call buying (and associated hedging) that boosts markets and bids IV.
| SpotGamma Proprietary SPX Levels | Latest Data | SPX Previous | SPY | NDX | QQQ |
|---|---|---|---|---|---|
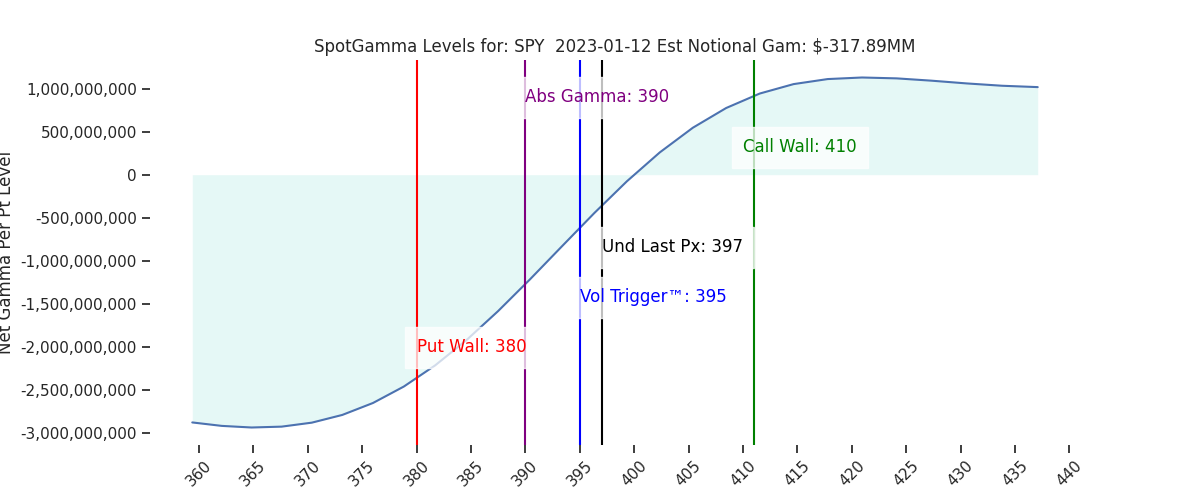
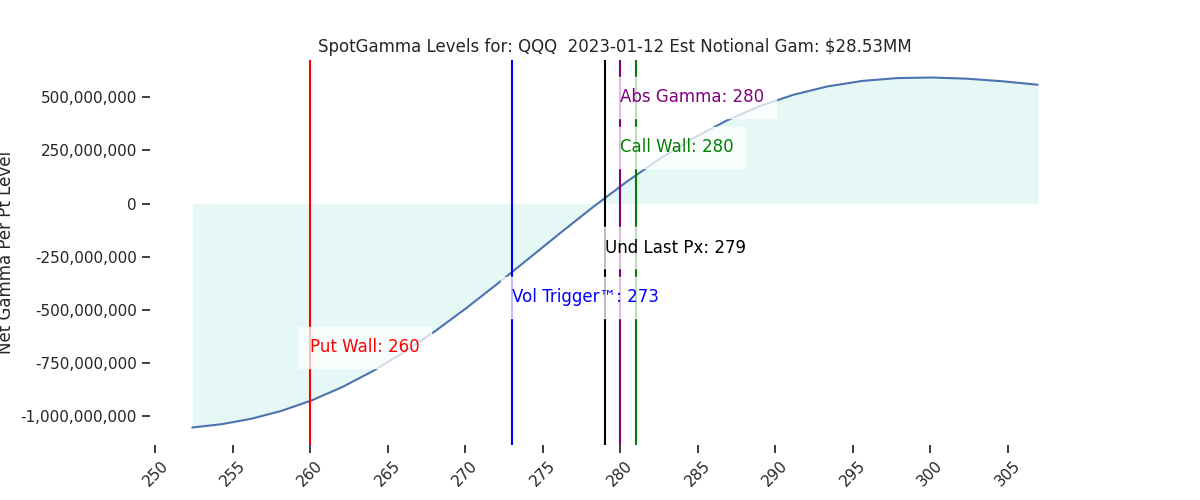
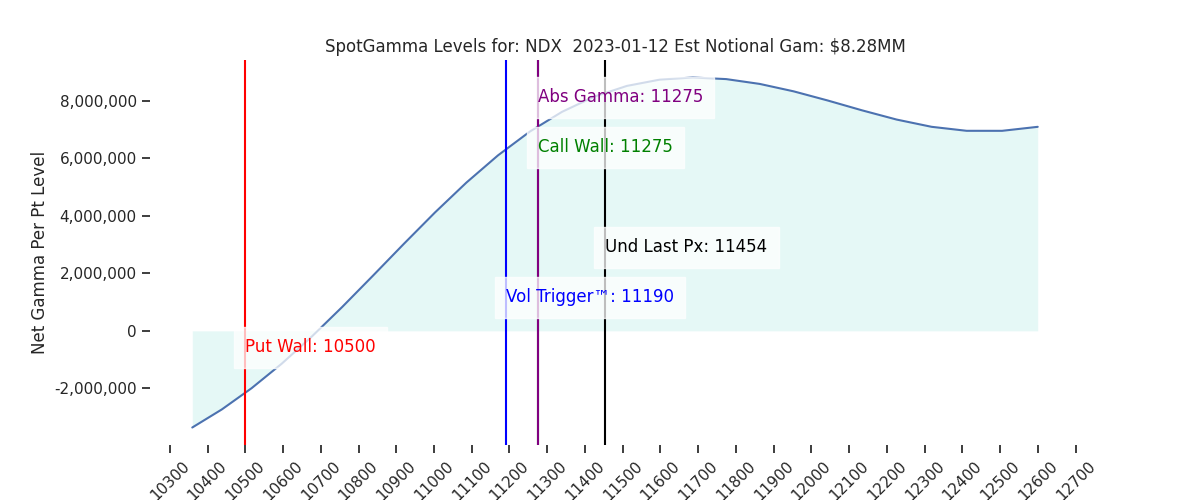
| Ref Price: | 3983 | 3969 | 397 | 11454 | 279 |
| SG Implied 1-Day Move:: | 1.08%, | (±pts): 43.0 | VIX 1 Day Impl. Move:1.2% | ||
| SG Implied 5-Day Move: | 3.0% | 3894 (Monday Ref Price) | Range: 3777.0 | 4011.0 | ||
| SpotGamma Gamma Index™: | 0.57 | 0.57 | -0.11 | 0.05 | -0.00 |
| Volatility Trigger™: | 3915 | 3915 | 395 | 11190 | 273 |
| SpotGamma Absolute Gamma Strike: | 4000 | 4000 | 390 | 11275 | 280 |
| Gamma Notional(MM): | 214.0 | 134.0 | -318.0 | 8.0 | 29.0 |
| Put Wall: | 3800 | 3800 | 380 | 10500 | 260 |
| Call Wall : | 4000 | 4000 | 410 | 11275 | 280 |
| Additional Key Levels | Latest Data | Previous | SPY | NDX | QQQ |
|---|---|---|---|---|---|
| Zero Gamma Level: | 3956 | 3971 | 399.0 | 10701.0 | 303 |
| CP Gam Tilt: | 1.17 | 1.08 | 0.89 | 1.76 | 1.02 |
| Delta Neutral Px: | 3950 | ||||
| Net Delta(MM): | $1,552,498 | $1,546,812 | $162,081 | $49,501 | $86,502 |
| 25D Risk Reversal | -0.05 | -0.04 | -0.04 | -0.04 | -0.04 |
| Call Volume | 624,412 | 624,412 | 1,827,522 | 9,329 | 1,026,994 |
| Put Volume | 919,804 | 919,804 | 3,089,669 | 9,126 | 1,115,677 |
| Call Open Interest | 5,845,956 | 5,845,956 | 6,813,753 | 67,915 | 4,983,063 |
| Put Open Interest | 10,387,937 | 10,387,937 | 12,726,959 | 60,494 | 6,660,952 |
| Key Support & Resistance Strikes: |
|---|
| SPX: [4000, 3950, 3900, 3850] |
| SPY: [400, 395, 390, 380] |
| QQQ: [285, 280, 270, 265] |
| NDX:[12000, 11500, 11275, 11000] |
| SPX Combo (strike, %ile): [(4159.0, 85.24), (4111.0, 95.89), (4087.0, 91.3), (4075.0, 89.3), (4059.0, 93.04), (4043.0, 75.47), (4039.0, 82.95), (4035.0, 89.02), (4023.0, 75.29), (4011.0, 98.08), (3983.0, 84.4), (3960.0, 79.91), (3860.0, 85.29), (3824.0, 86.06), (3808.0, 93.09)] |
| SPY Combo: [400.12, 410.04, 379.87, 404.88, 407.66] |
| NDX Combo: [11307.0, 10918.0, 11535.0, 11947.0, 11741.0] |