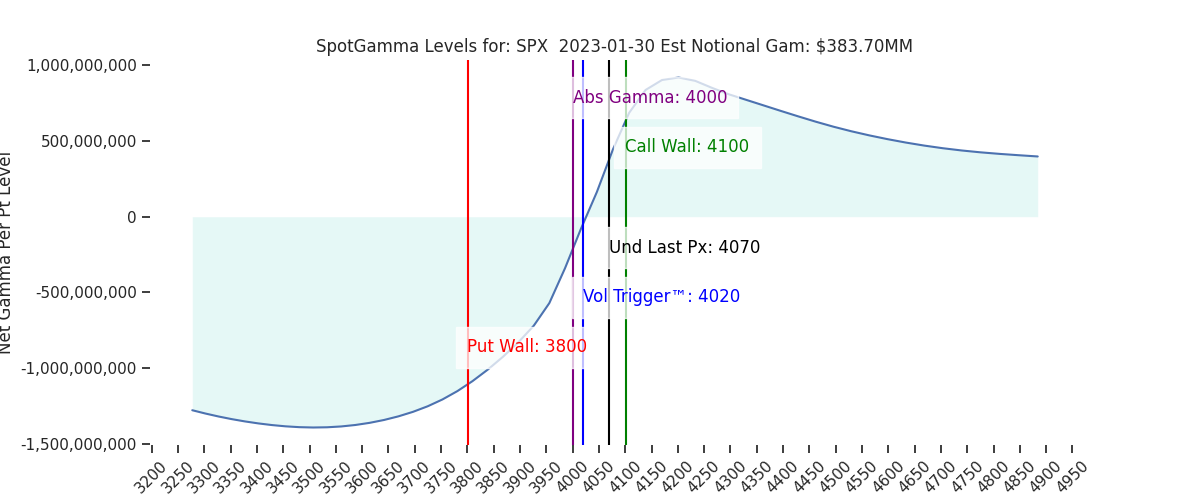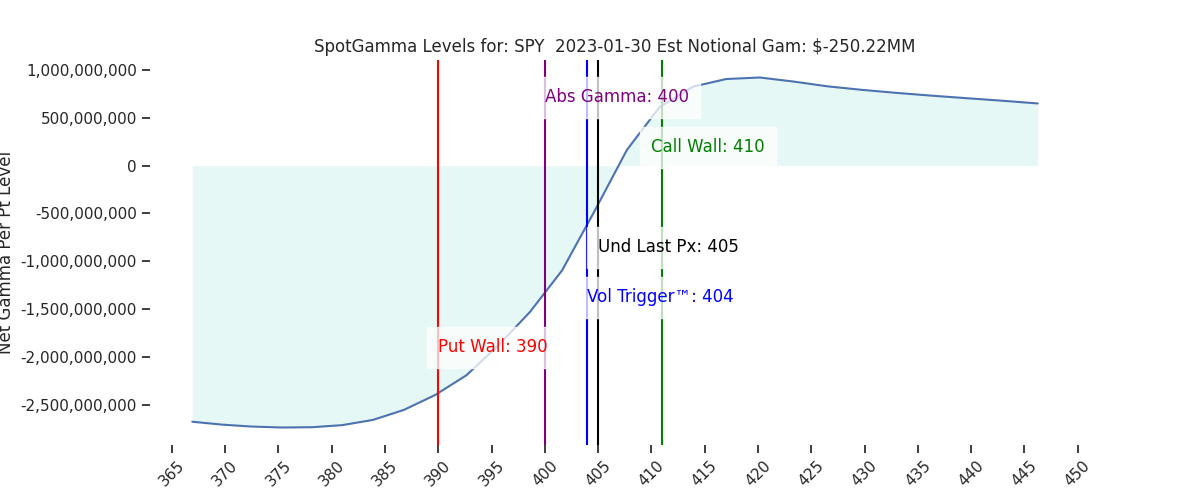
Futures have pulled back from 4050, digesting some of last weeks gains. We continue to register the 4050-4065 (SPY 405) as major first resistance, with 4100 resistance over that level. There is a band of support levels below at 4020/4015 (SPY400) & 4000. We do not register support beneath 4000 until 3911.
Note there is a ton of data out this week: FOMC, Jobless claims, non farms + 20% of S&P earnings reports (including AAPL on Thursday).
Friday saw huge volume at the 4100SPX call strike (168k), and we now see that strike growing in size from an OI/gamma perspective particularly at 410SPY. This adds to overhead resistance in through Wednesdays FOMC, and we remain of the opinion that the 4050-4065 SPX area should continue to function as heavy resistance until 2/1. 4000 should remain as support into 2/1.

The other interesting data point comes from the OCC, which revealed that, on net, traders were sellers of call options last week. We explain this in a video here, and you can see it in the cart below (calls in blue, puts orange).
While there was clearly call buying to start the week (as single stocks ripped), we think this “net selling” data is being driven by the fact that most of the flow is in very short dated activity. In other words, for example, traders buying calls in TSLA are in for the daily momentum chase and therefore closing positions shortly after buying. Traders do not appear to be trying to position for Q2 and beyond.

Its a similar idea on the Index side wherein “real money” call buying (blue) is decent, but not exceptional. Keep in mind this chart below is from a premium perspective. One does not look at this chart and get the sense that everyone has bought it on a further +10% rally (or crash as put buying(orange) is muted).

Compare the chart above to Index flow measured through number of contracts bought. This chart makes it seem like there are much larger flows – but whats happening here is 0DTE.
From a premium perspective 0DTE trading is high volume but its of low premium (todays ATM call costs much less that a call that expires 6 months out), and so we see huge contract volume but “not much” when measured via premiums. In other words, big money call buyers haven’t yet rushed in.

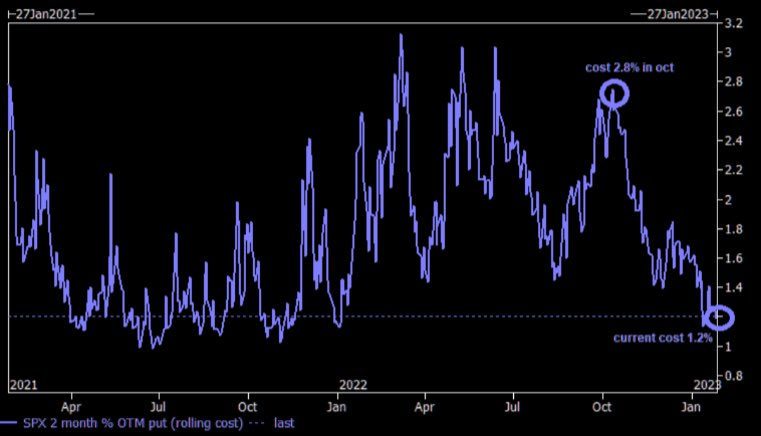
Lack of long term call buying does not mean there is demand to hedge downside. Shown below is:
“Cost of downside protection via puts at 2-year low The absolute cost of a 2 month 5% put in SPX is trading at one of the lowest level in ~2 years. Below the level of the top of the “summer squeeze of 2022” last August.” (h/t TME).
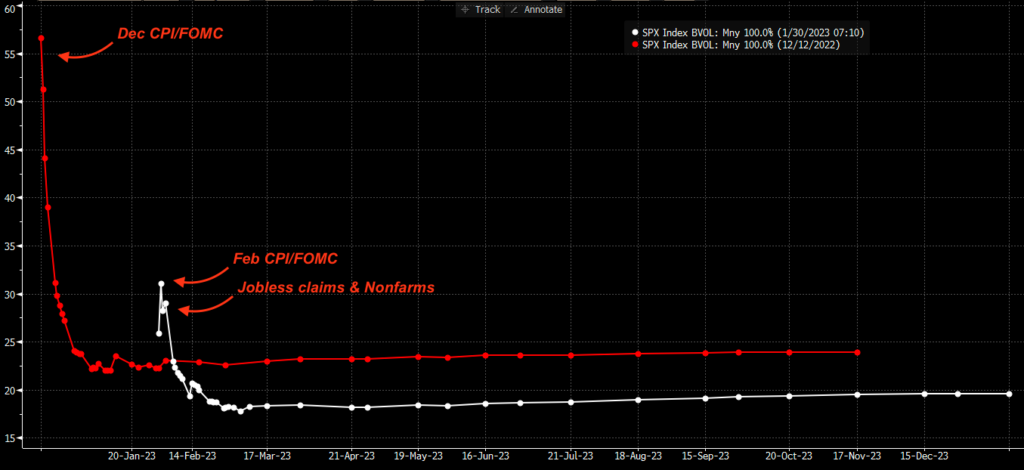
When we look at IV, it further clarifies that the options market sees much lower overall risk. Shown below is the SPX term structure for today (white) vs heading into Dec CPI & FOMC (red). As you can see traders were anticipating much higher volatility driven from Dec data.
Our point here is that there seems to be a perception that this giant bull market is about to launch, but we feel a lot of that is ulta-short term momentum. This chasing is compounded by the short dated options trade and short stock covering. This generates a lot of pretty “breakout charts” as it adds to an illusion of fundamental strength.
The issue here is that this flow is fleeting, and prone to disappearing in an instant. Further it appears the tail that is not being hedged is hawkishness from the FOMC.
Our point here is that from an options positioning perspective the market seems prone to a real sucker punch. This does not mean Powell delivers one, but it seems that outcome is underpriced.
| SpotGamma Proprietary SPX Levels | Latest Data | SPX Previous | SPY | NDX | QQQ |
|---|---|---|---|---|---|
| Ref Price: | 4070 | 4087 | 405 | 12166 | 296 |
| SG Implied 1-Day Move:: | 1.08%, | (±pts): 44.0 | VIX 1 Day Impl. Move:1.16% | ||
| SG Implied 5-Day Move: | 2.87% | 4070 (Monday Ref Price) | Range: 3953.0 | 4187.0 | ||
| SpotGamma Gamma Index™: | 0.89 | 1.31 | -0.04 | 0.05 | 0.00 |
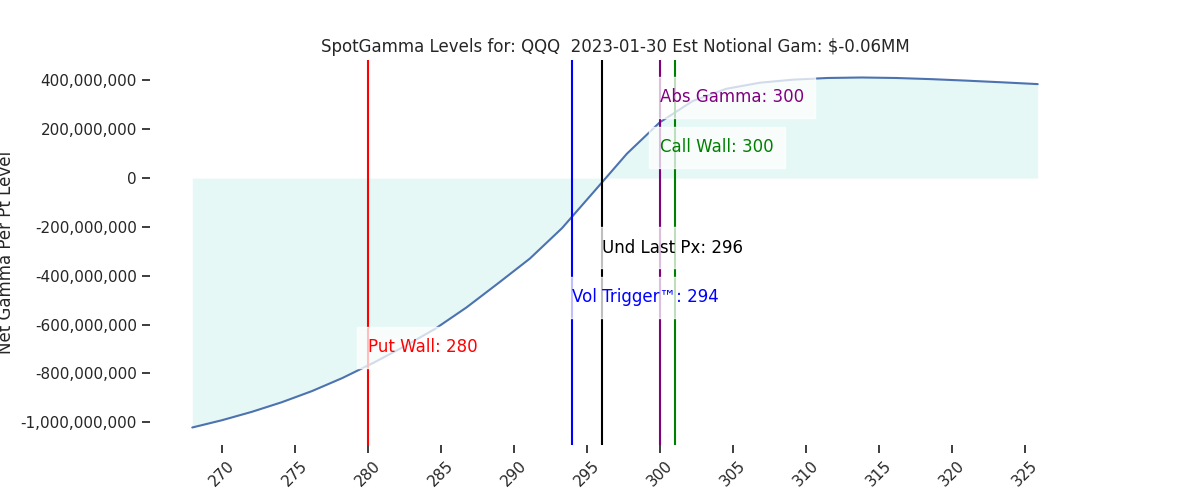
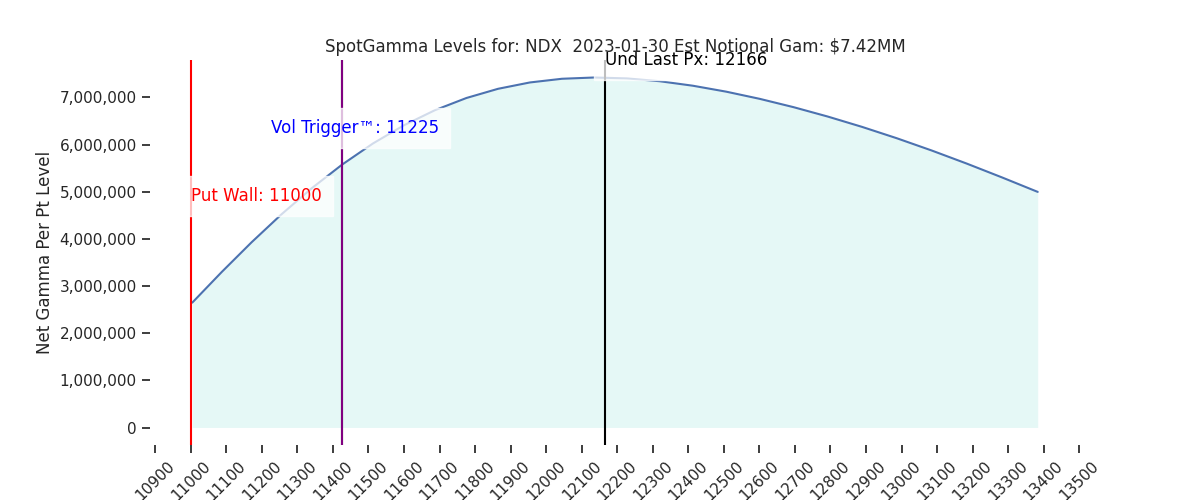
| Volatility Trigger™: | 4020 | 4020 | 404 | 11225 | 294 |
| SpotGamma Absolute Gamma Strike: | 4000 | 4000 | 400 | 11425 | 300 |
| Gamma Notional(MM): | 384.0 | 625.0 | -250.0 | 7.0 | -0.0 |
| Put Wall: | 3800 | 3900 | 390 | 11000 | 280 |
| Call Wall : | 4100 | 4100 | 410 | 11425 | 300 |
| Additional Key Levels | Latest Data | Previous | SPY | NDX | QQQ |
|---|---|---|---|---|---|
| Zero Gamma Level: | 4031 | 4017 | 405.0 | 0 | 311 |
| CP Gam Tilt: | 1.27 | 1.42 | 0.93 | 1.83 | 1.0 |
| Delta Neutral Px: | 3976 | ||||
| Net Delta(MM): | $1,487,401 | $1,434,570 | $163,182 | $56,111 | $87,127 |
| 25D Risk Reversal | -0.05 | -0.05 | -0.04 | -0.04 | -0.04 |
| Call Volume | 512,369 | 602,249 | 2,286,241 | 12,997 | 964,662 |
| Put Volume | 1,055,379 | 846,003 | 3,094,103 | 9,046 | 1,269,354 |
| Call Open Interest | 5,533,366 | 5,442,991 | 5,907,873 | 61,166 | 4,216,790 |
| Put Open Interest | 10,139,506 | 10,129,755 | 12,286,055 | 56,330 | 7,148,974 |
| Key Support & Resistance Strikes: |
|---|
| SPX: [4100, 4050, 4000, 3900] |
| SPY: [410, 407, 405, 400] |
| QQQ: [300, 295, 290, 280] |
| NDX:[13000, 12000, 11500, 11425] |
| SPX Combo (strike, %ile): [(4249.0, 89.09), (4225.0, 84.52), (4200.0, 96.28), (4176.0, 90.0), (4151.0, 97.8), (4143.0, 77.67), (4139.0, 75.87), (4123.0, 91.37), (4115.0, 89.48), (4111.0, 76.32), (4099.0, 98.96), (4094.0, 79.79), (4074.0, 95.11), (4066.0, 88.44), (4050.0, 87.99), (4029.0, 79.34), (3948.0, 78.07), (3911.0, 81.16), (3899.0, 90.04)] |
| SPY Combo: [408.52, 413.79, 418.66, 406.09, 410.95] |
| NDX Combo: [12325.0, 12532.0, 12726.0, 11996.0] |