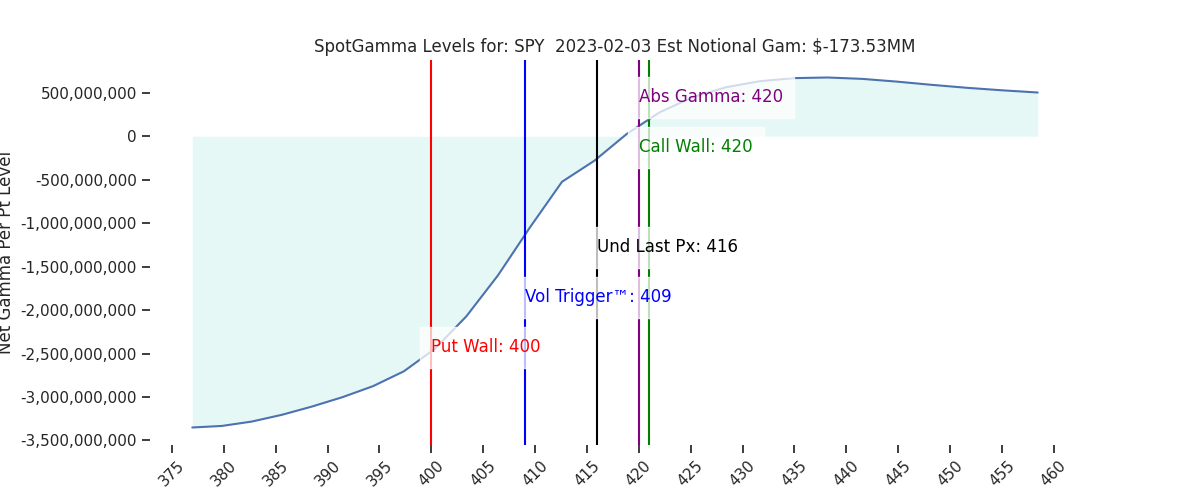
Futures were muted overnight, holding 4165. The S&P Call Walls unsurprisingly shifted to 420SPY/4200 SPX, which is now the high end of our range. 4150-4165 (SPY415) is the pivot area, and 4115 (SPY 410) – 4100 is support. Please note these SPY levels, as the S&P has been reacting to them arguably more so than SPX.
As most of you are likely aware, there was record options volume yesterday, driven by frenetic call activity. Per GS (h/t ZH):
“Goldman strategists break the action down and note that mega cap tech upside was the main driver: some 2.7mm TSLA calls (1.6mm avg) trader, as well as 1.8mm AMZN calls (600k avg), 1.4mm META calls (225k avg), 1.3mm AAPL calls (600k avg) and so on.”

This led to some amazing price action. The main theme of the day was “stock up, vol up” as traders chased upside across the board. Anytime you see IV moving up in context with price, it’s generally a sign of exuberance and often creates price moves that are very hard to sustain (particularly in extreme situations like yesterday).
This is because as the stock rises, options values rise asymmetrically (due to vega/rising IV), and dealers are left buying/chasing the stock. Once the upside momentum pauses those options immediately start to lose value, and dealers can then start to sell stock, which presses the stock lower.
You can see how this is a series of feedback loops wherein its nearly impossible for a stock to have stock up/vol up and “pin” higher. All the energy builds in the move higher, and discharges immediately as upside momentum stops.
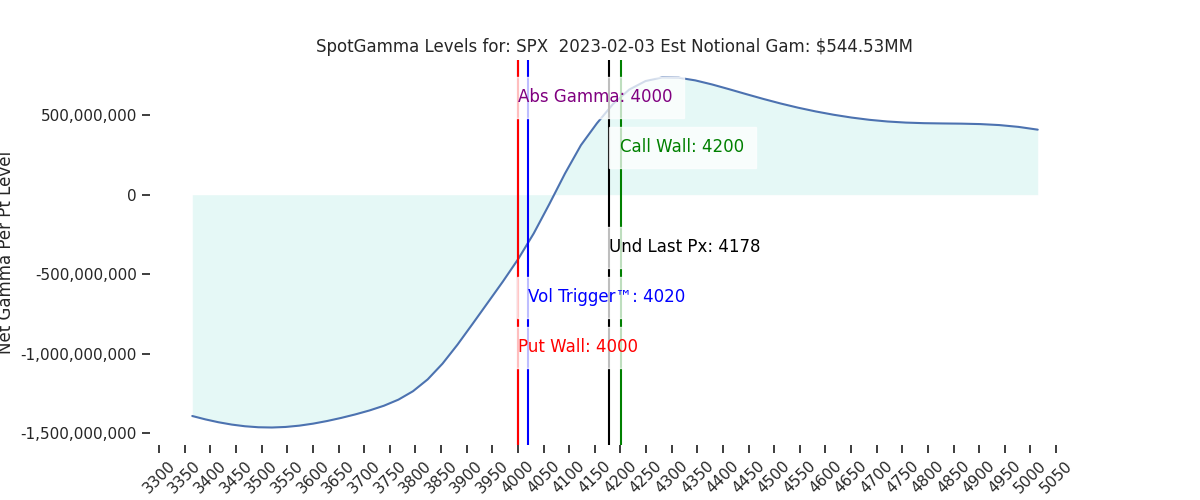
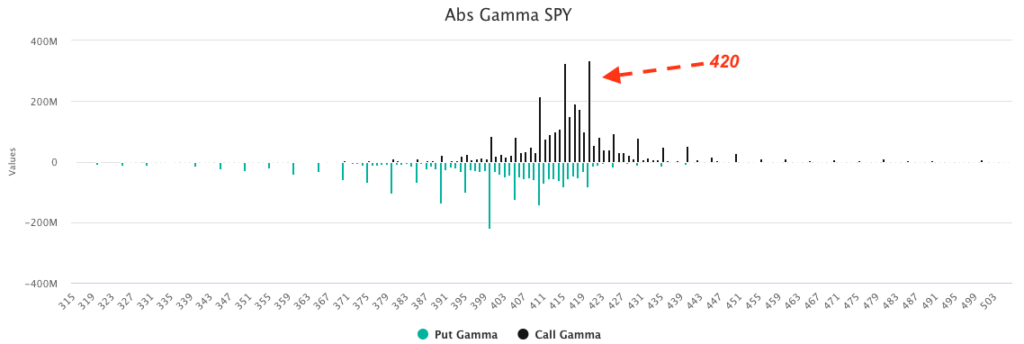
Pivoting now to the current setup in the S&P, 420/4200 saw a large build in interest. We did see a bit of action at higher strikes in the SPX, but as you can see below, SPY 420 is a large wall. Further, it was clear a lot of calls were bought over the last several sessions, making gamma not as positive as many surmise. We think that AAPL/AMZN/GOOGL earnings may have iced some sentiment. This may shift some to layer in short calls, adding to positive gamma which slows the markets ascent.
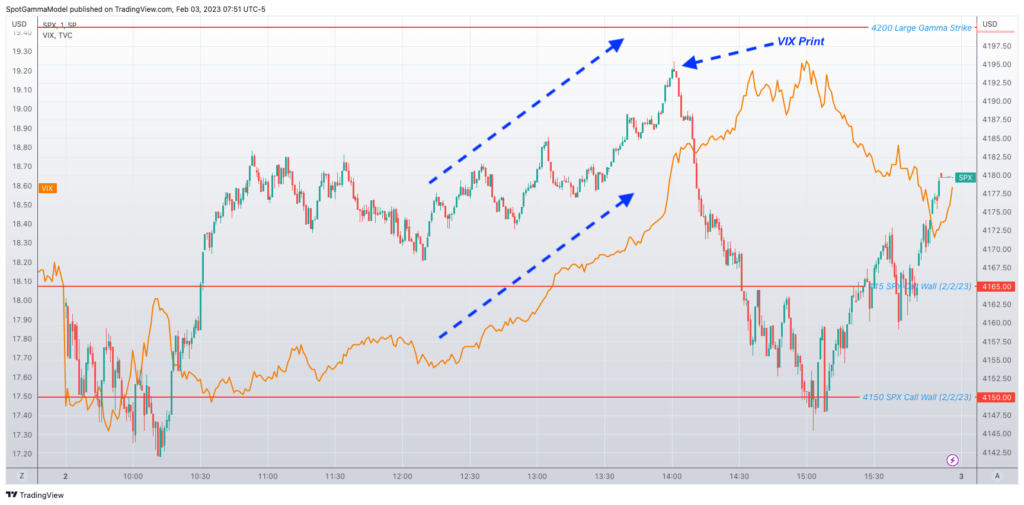
On this point of positive/negative gamma, the S&P made a break for that 4200 level intraday at which point the VIX started shifting higher. It was on this ramp to 4200 that some large March VIX call trades went off at 2pm (300k March 24 & 26 VIX calls per ZH) and this discharged the rally, leading to a retest of the 415SPY & 4150SPX area.
One could make the argument that some of that pre-2pm ET VIX ramp was due to hedging flows related to the huge VIX trade, but as you can see below the VIX up/SPX up movement started around noon.
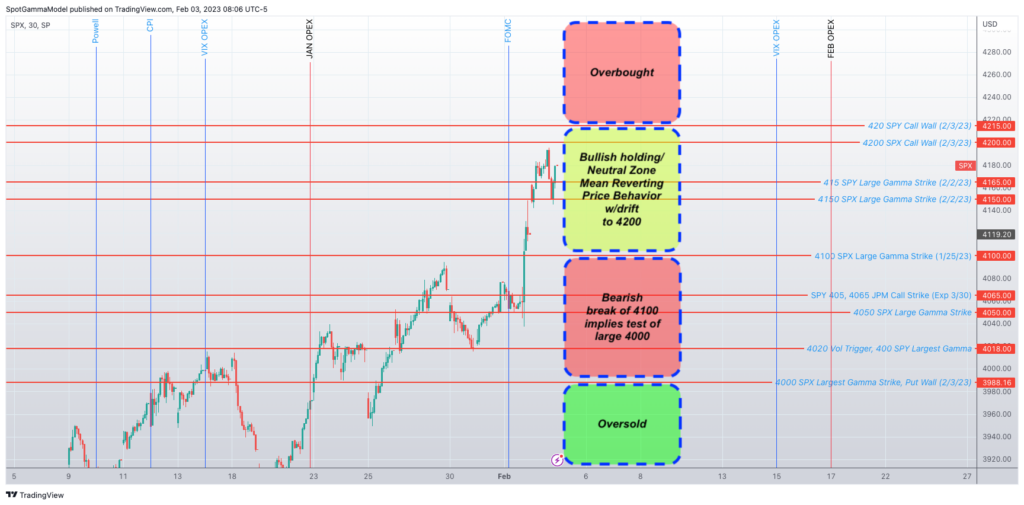
Our bottom line is this: the “map” we posted on Tuesday remains in play. We think the market should remain well supported inside of the 4100’s, with 4200 – 4215 (SPY 420) functioning as resistance. For now we favor some consolidation in the 4100’s and give edge to markets eventually pinning up into 4200 over the next few sessions. If/when the Call Walls roll higher we will look for higher S&P prices.
While we see buyers at 4100, a break of this level continues to be our “risk off” signal, and likely leads to a test of 4000.
| SpotGamma Proprietary SPX Levels | Latest Data | SPX Previous | SPY | NDX | QQQ |
|---|---|---|---|---|---|
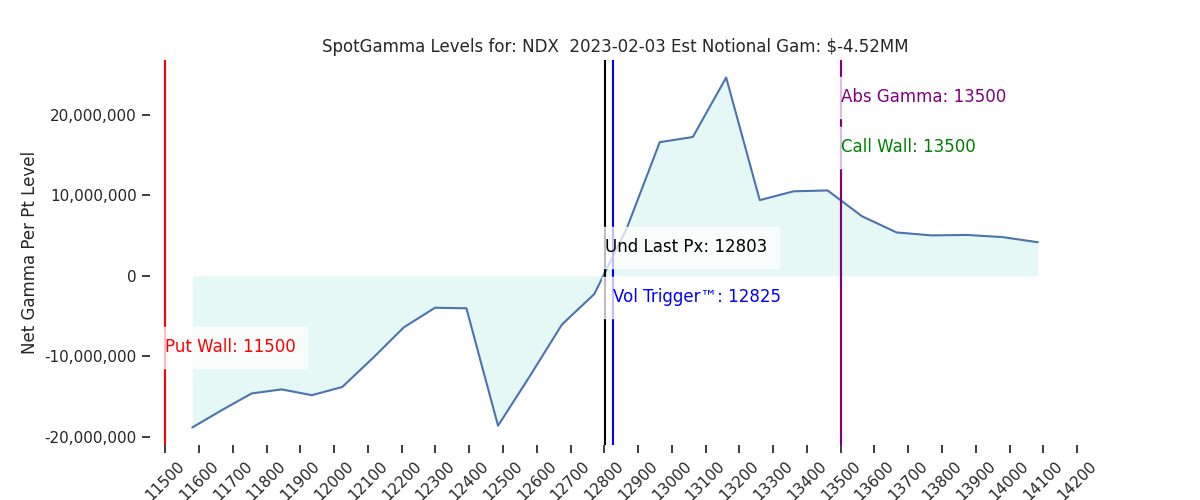
| Ref Price: | 4178 | 4163 | 416 | 12803 | 311 |
| SG Implied 1-Day Move:: | 1.09%, | (±pts): 46.0 | VIX 1 Day Impl. Move:1.16% | ||
| SG Implied 5-Day Move: | 2.87% | 4070 (Monday Ref Price) | Range: 3953.0 | 4187.0 | ||
| SpotGamma Gamma Index™: | 1.78 | 1.37 | 0.08 | -0.01 | 0.08 |
| Volatility Trigger™: | 4020 | 4020 | 409 | 12825 | 304 |
| SpotGamma Absolute Gamma Strike: | 4000 | 4000 | 420 | 13500 | 310 |
| Gamma Notional(MM): | 545.0 | 737.0 | -174.0 | -5.0 | 236.0 |
| Put Wall: | 4000 | 3800 | 400 | 11500 | 285 |
| Call Wall : | 4200 | 4150 | 420 | 13500 | 310 |
| Additional Key Levels | Latest Data | Previous | SPY | NDX | QQQ |
|---|---|---|---|---|---|
| Zero Gamma Level: | 4076 | 4062 | 416.0 | 12785.0 | 319 |
| CP Gam Tilt: | 1.64 | 1.55 | 0.94 | 0.1 | 1.2 |
| Delta Neutral Px: | 4051 | ||||
| Net Delta(MM): | $1,569,405 | $1,544,038 | $169,582 | $14,676 | $98,340 |
| 25D Risk Reversal | -0.06 | -0.04 | -0.05 | -0.03 | -0.06 |
| Call Volume | 809,736 | 579,049 | 2,698,887 | 7,254 | 1,660,096 |
| Put Volume | 1,229,000 | 928,583 | 4,327,669 | 13,441 | 1,871,048 |
| Call Open Interest | 5,408,272 | 5,718,628 | 5,732,061 | 19,811 | 4,389,864 |
| Put Open Interest | 10,585,201 | 10,054,509 | 14,257,854 | 53,846 | 8,231,257 |
| Key Support & Resistance Strikes: |
|---|
| SPX: [4200, 4150, 4100, 4000] |
| SPY: [420, 415, 410, 400] |
| QQQ: [315, 310, 305, 300] |
| NDX:[13500, 13000, 11500, 11000] |
| SPX Combo (strike, %ile): [(4350.0, 88.06), (4325.0, 74.98), (4300.0, 97.74), (4275.0, 89.36), (4270.0, 75.89), (4250.0, 97.34), (4237.0, 79.4), (4225.0, 96.12), (4220.0, 85.07), (4212.0, 90.58), (4208.0, 84.21), (4199.0, 99.54), (4187.0, 85.56), (4183.0, 89.3), (4179.0, 85.45), (4174.0, 98.0), (4170.0, 91.95), (4162.0, 90.19), (4158.0, 80.09), (4149.0, 99.16), (4137.0, 76.49), (4124.0, 76.7), (4099.0, 93.82), (4066.0, 85.72), (3999.0, 91.5)] |
| SPY Combo: [418.86, 413.86, 416.36, 428.87, 423.87] |
| NDX Combo: [12726.0, 12944.0, 13149.0, 12854.0, 13021.0] |