Futures have pulled back to 4115, implying a SPX cash open near 4100. SpotGamma levels are unchanged from Friday, with key support at 4100, followed by 4065 (SPY 405). Resistance above lies at 4150 – 4165 (SPY 415).
Our view coming into todays session was that equities needed to consolidate last weeks large gains, but that we anticipated the bullish trend to remain intact through next weeks expiration (discussed here).
There are essentially 2 triggers that would pull this bullish bias away from equities:
The first one is price based (a break of 4100), and the second is time based (2/14 CPI + 2/15 VIX exp + 2/17 OPEX).
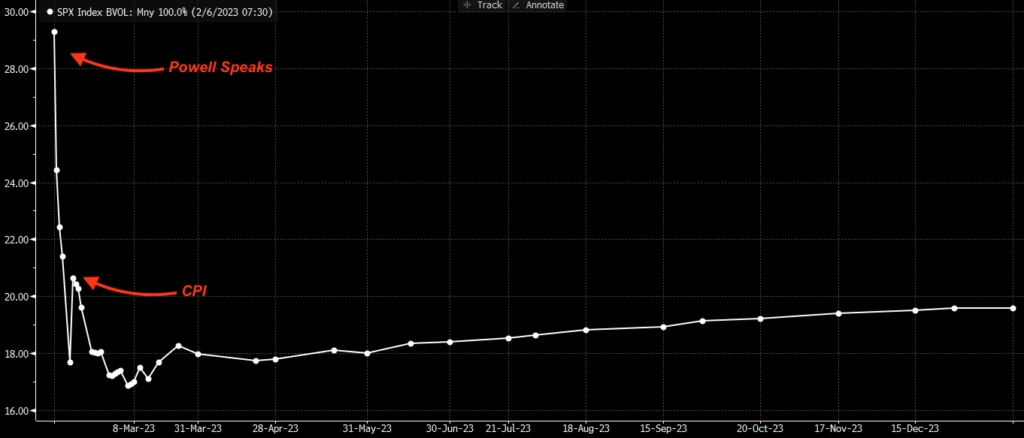
This morning we are testing the key 4100 support level, as markets await Powells appearance tomorrow. Powell speaking has elevated short term IV, which keeps the term structure technically in backwardation (as shown below). You may note the other date of significance is 2/14 CPI which syncs up with VIX exp/OPEX to open a window for higher volatility.
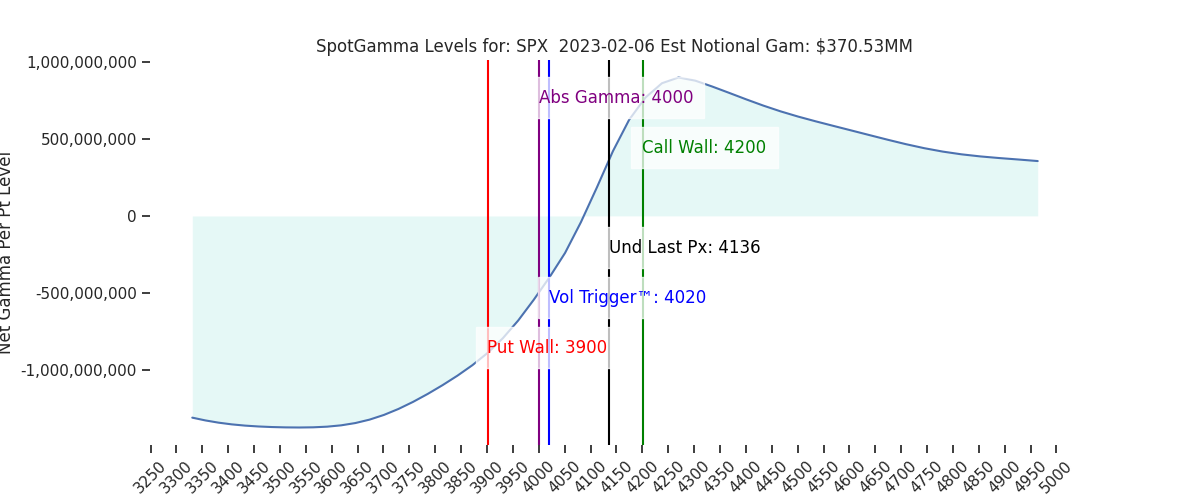
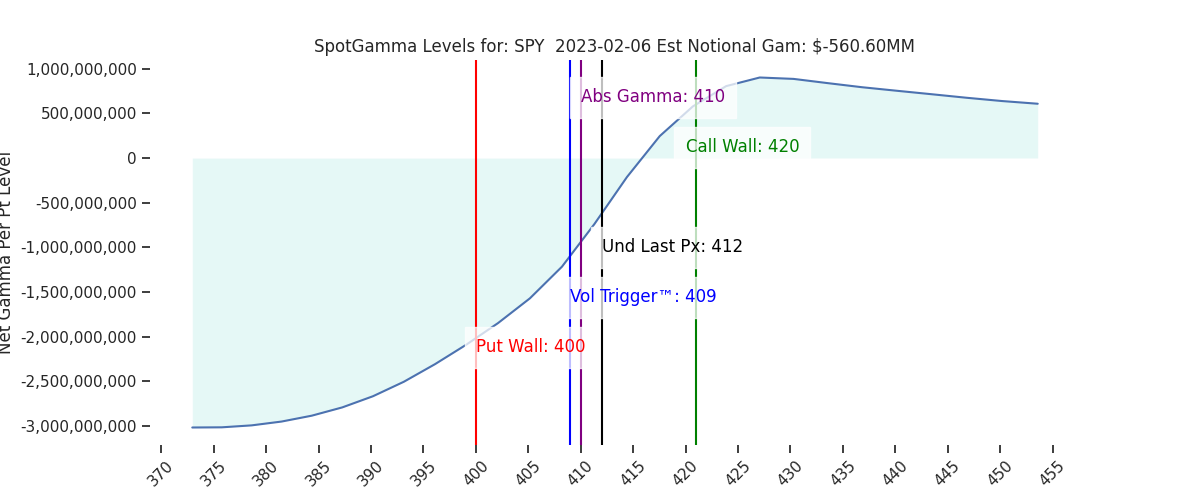
If 4100 support is broken, then we think it’s likely that 4000 becomes the area of attraction into 2/14 CPI. The reason for this is that the center of hedging flows likely jumps to 4000 from the 4100-4200 area. As you can see below, 4000 SPX (+ 400 SPY) remains a very large gamma strike which only increases in size should SPX test 4000 (recall that gamma is highest for ATM strikes).

Back to this idea of the “technical” backwardation in SPX term structure – outside of volatility tied to whatever the next data-drop/Fed-Speak, the SPX term structure is in low fear contango. Meaning, if you look at the term structure post-CPI in the chart above, its upward sloping. The same is true for VIX futures, as shown below.

Further if you look at skew indicies, there is not much “material” fear out there. Ultra short term IV is elevated due to the tail risks of various events (like Powell pulling a J-HOLE or 3 std dev CPI print), but betting on those tails is a tough game.
The point here is that we think there is a lot of focus on the “ultra short term/0DTE” which is warranted for people that trade 0DTE, but not so much everyone else.
Was upside price volatility last week energized by 0DTE? We believe thats true, but we also believe that there were call positions building throughout January which built the ramp for a final push higher.
We bring all this up as it seems now that non-options folks are raising a flag around 0DTE and its dominance of market behavior (ex: here). There is also this chorus of “VIX is useless” rising (many options aficionados may believe this – but they’ve thought this way for many years). However, what I we the VIX is telling us is that “real money” isn’t hedging for major market downside. There is a signal in the fact that the VIX isn’t doing much.
Our point here is that 0DTE can exacerbate very short term market movements, which presents opportunities for those watching markets. It is not, in our view, a significant driver of long term trend.
And, yes, there is a major risk associated with heavy “daytrading” of options (something we covered in Nov of ’22). However, outside of this tail risk, we think 0DTE can stretch intraday volatility around the longer term trends.
| SpotGamma Proprietary SPX Levels | Latest Data | SPX Previous | SPY | NDX | QQQ |
|---|---|---|---|---|---|
| Ref Price: | 4136 | 4134 | 412 | 12573 | 306 |
| SG Implied 1-Day Move:: | 1.07%, | (±pts): 44.0 | VIX 1 Day Impl. Move:1.16% | ||
| SG Implied 5-Day Move: | 2.85% | 4136 (Monday Ref Price) | Range: 4019.0 | 4254.0 | ||
| SpotGamma Gamma Index™: | 1.05 | 1.75 | -0.12 | 0.04 | -0.00 |
| Volatility Trigger™: | 4020 | 4020 | 409 | 11225 | 304 |
| SpotGamma Absolute Gamma Strike: | 4000 | 4000 | 410 | 13000 | 300 |
| Gamma Notional(MM): | 371.0 | 367.0 | -561.0 | 7.0 | -9.0 |
| Put Wall: | 3900 | 4000 | 400 | 11000 | 300 |
| Call Wall : | 4200 | 4200 | 420 | 12650 | 310 |
| Additional Key Levels | Latest Data | Previous | SPY | NDX | QQQ |
|---|---|---|---|---|---|
| Zero Gamma Level: | 4096 | 4064 | 414.0 | 0 | 320 |
| CP Gam Tilt: | 1.3 | 1.22 | 0.85 | 1.77 | 0.99 |
| Delta Neutral Px: | 4010 | ||||
| Net Delta(MM): | $1,655,198 | $1,552,974 | $182,516 | $65,824 | $102,655 |
| 25D Risk Reversal | -0.05 | -0.06 | -0.04 | -0.04 | -0.04 |
| Call Volume | 517,280 | 809,736 | 2,305,638 | 7,577 | 963,316 |
| Put Volume | 968,965 | 1,229,000 | 3,191,073 | 10,314 | 1,374,131 |
| Call Open Interest | 5,772,301 | 5,408,272 | 6,197,217 | 66,724 | 4,644,532 |
| Put Open Interest | 10,589,519 | 10,585,201 | 13,782,000 | 64,413 | 7,880,475 |
| Key Support & Resistance Strikes: |
|---|
| SPX: [4150, 4100, 4050, 4000] |
| SPY: [420, 415, 410, 400] |
| QQQ: [310, 305, 300, 290] |
| NDX:[13000, 12650, 12500, 12000] |
| SPX Combo (strike, %ile): [(4302.0, 96.53), (4273.0, 88.41), (4248.0, 95.3), (4223.0, 92.0), (4215.0, 78.96), (4199.0, 98.22), (4174.0, 93.97), (4170.0, 77.27), (4161.0, 85.06), (4149.0, 97.4), (4124.0, 82.58), (4099.0, 91.94), (4066.0, 84.03), (4012.0, 77.04), (4000.0, 77.24), (3950.0, 88.32)] |
| SPY Combo: [418.54, 413.59, 428.84, 423.48, 416.06] |
| NDX Combo: [12724.0, 13139.0, 12322.0, 12938.0, 12649.0] |