Futures held a 30 point range overnight, trading +50bps to 3905. All eyes are on the 8:30 AM ET CPI.
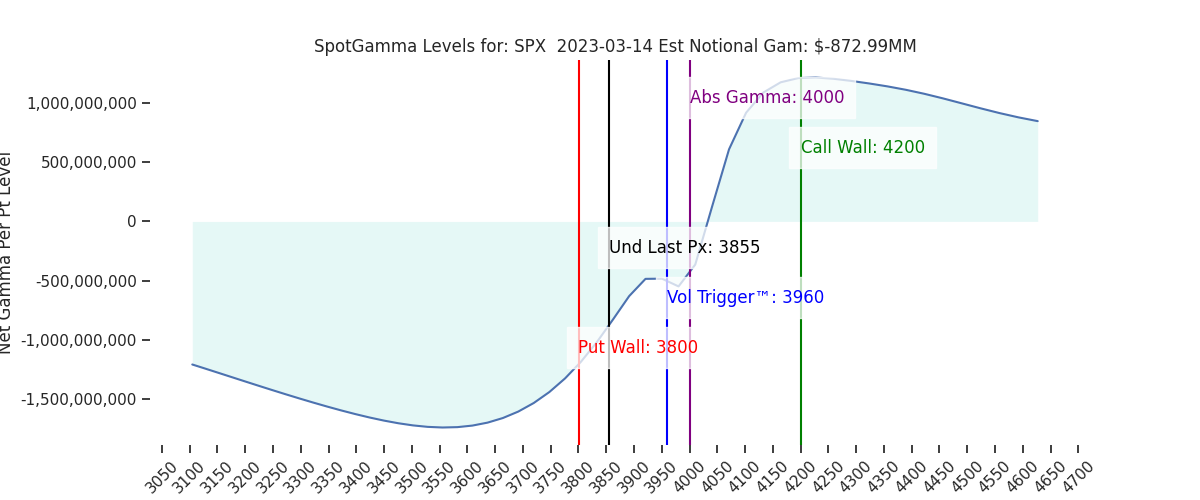
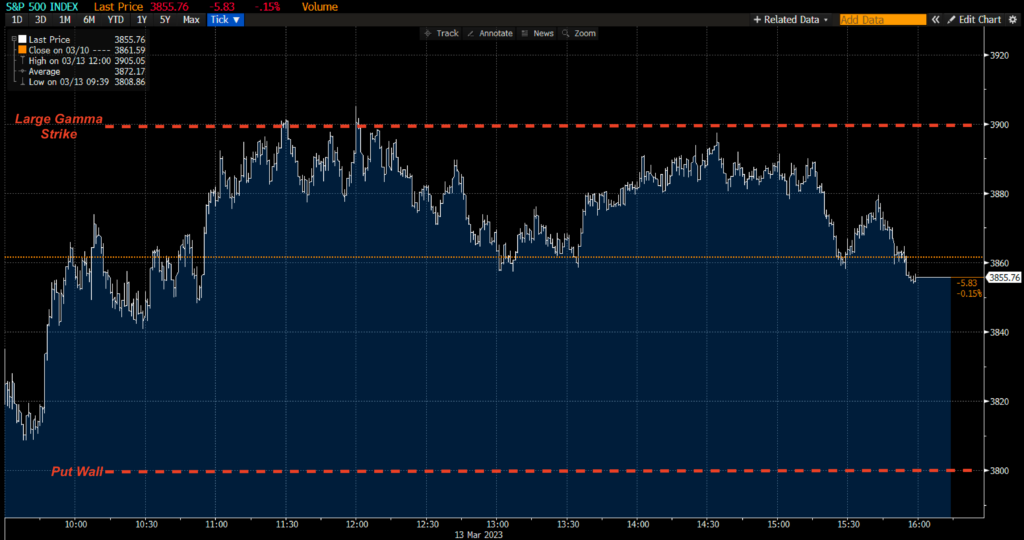
Key SG levels are unchanged, with 3850 SPX showing as first support, followed by the 3800 Put Wall. The Put Wall is the low end of our trading range, and a level we consider final support. Resistance above shows at 3900, then 3950.
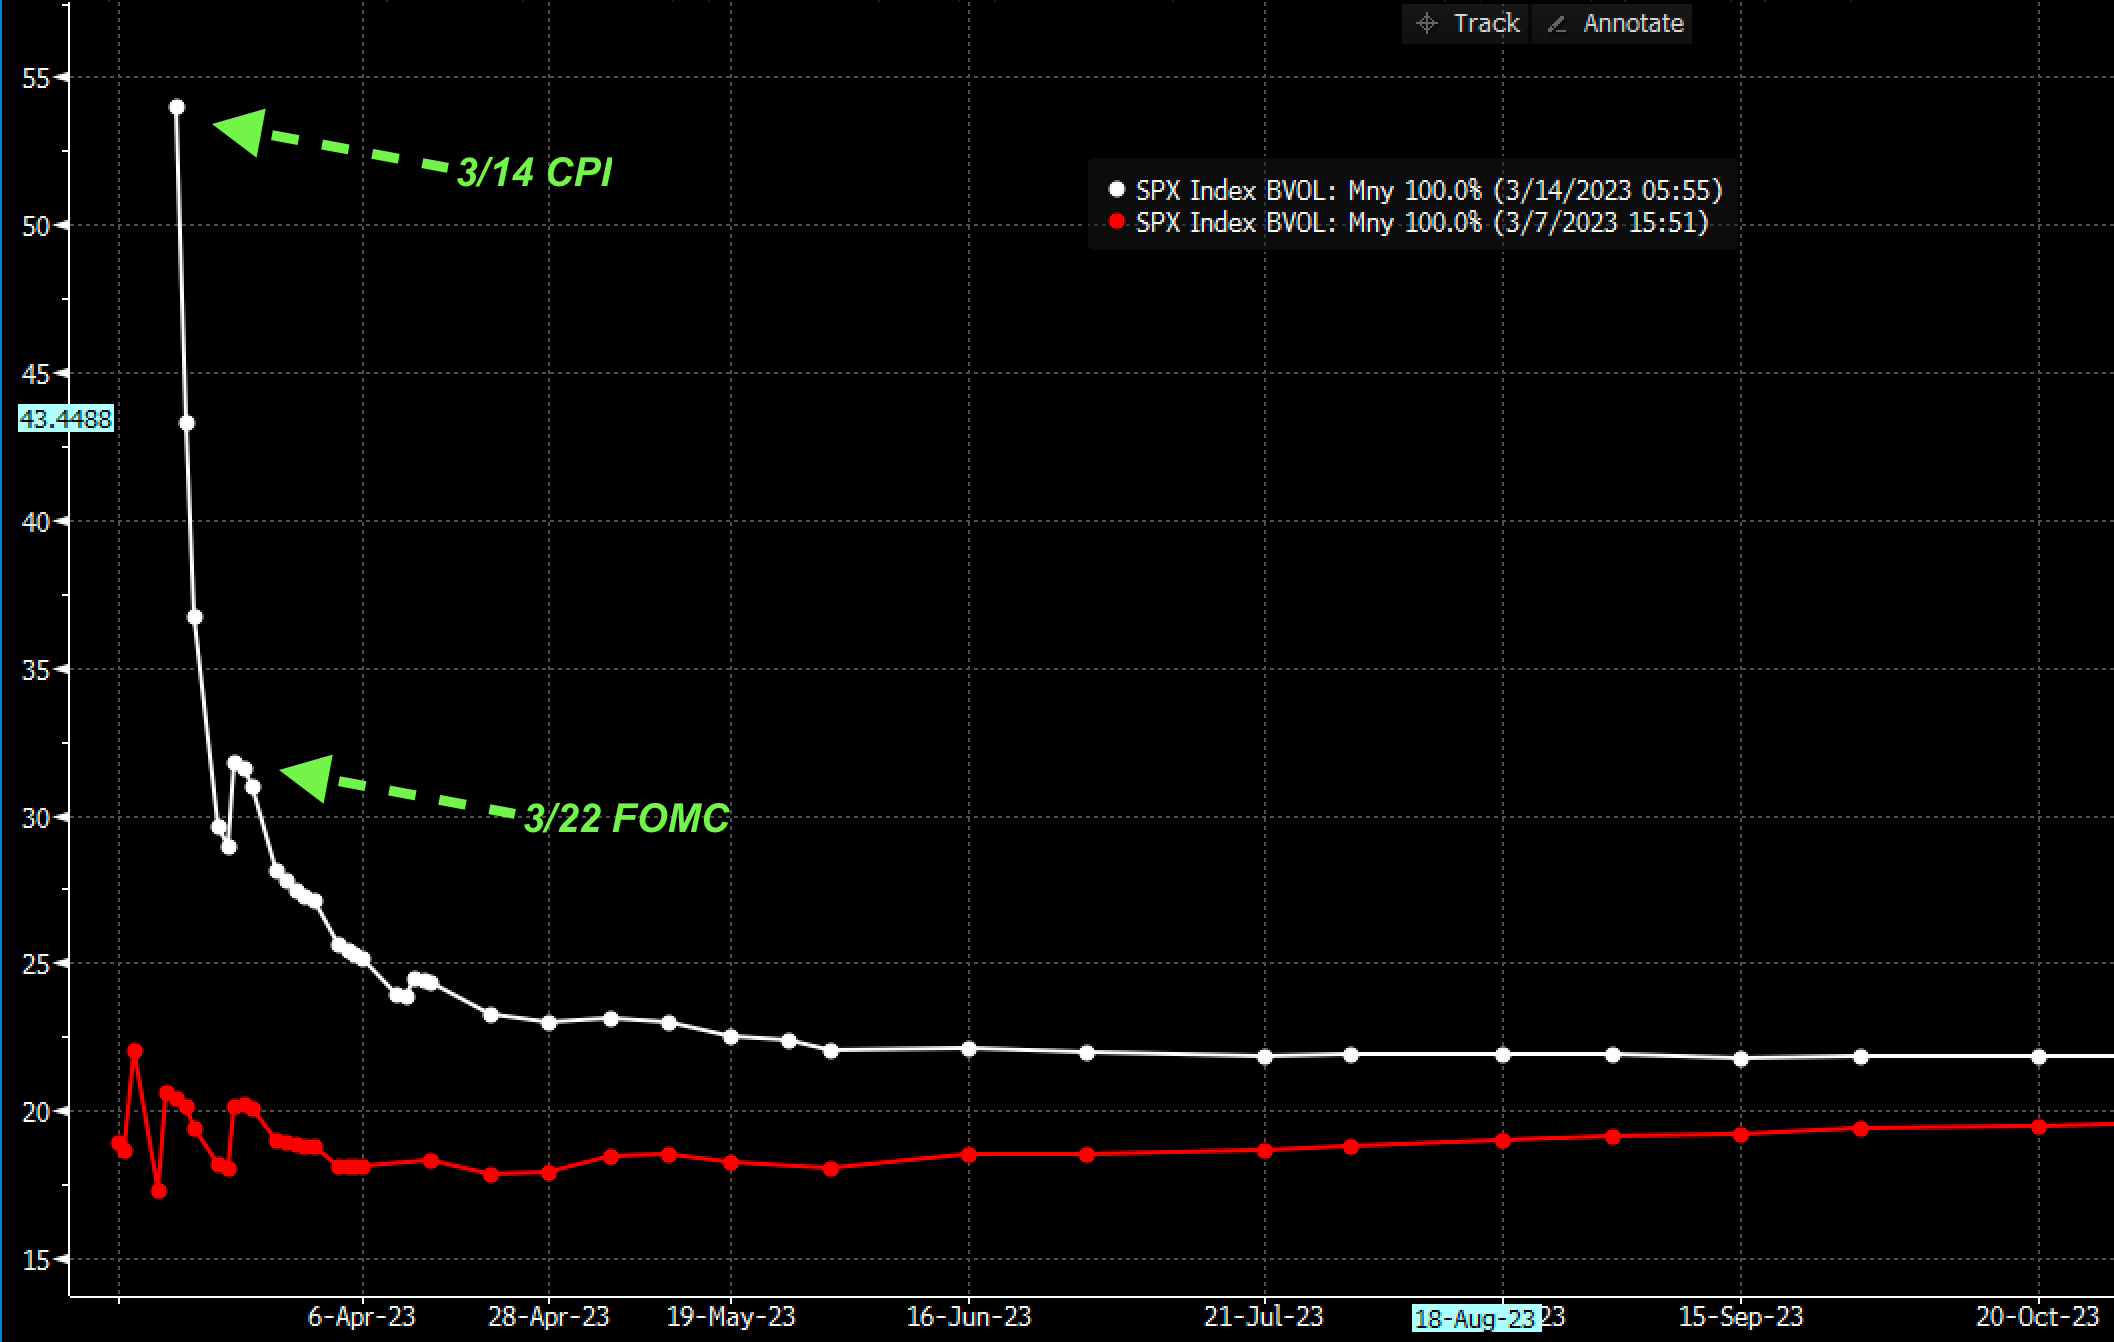
Implied volatility remains in backwardation, with traders assigning high volatility around today’s CPI print. Current IV levels imply traders are looking for a ~1.5% SPX move, and we note today’s ATM 0DTE straddle is trading at $68 (ref 3875, IV 66%).
The Vol Trigger has moved from 4000 down to 3960, which is a function of 30k calls & 5k puts added to the 3900 strike. This open interest increase was on massive 3900 call & put volume of 150k & 80k, respectively. That’s huge volume for a single strike.
Given this volume, its not surprising that 3900 functioned yesterday as such strong resistance. Further, as noted yesterday, 3900 is the level that must be recaptured for a bulls to have some measure of relative safety. If 3900 is breached, we look for a quick test of 3950.
Critically, rallies into 3900 should still be seen under the context of short covering, and subject to quick reversals.
Other notable downside strike volumes:
>3800: huge volume +100k, +10K open interest
>3700: 50k volume, +20k open interest
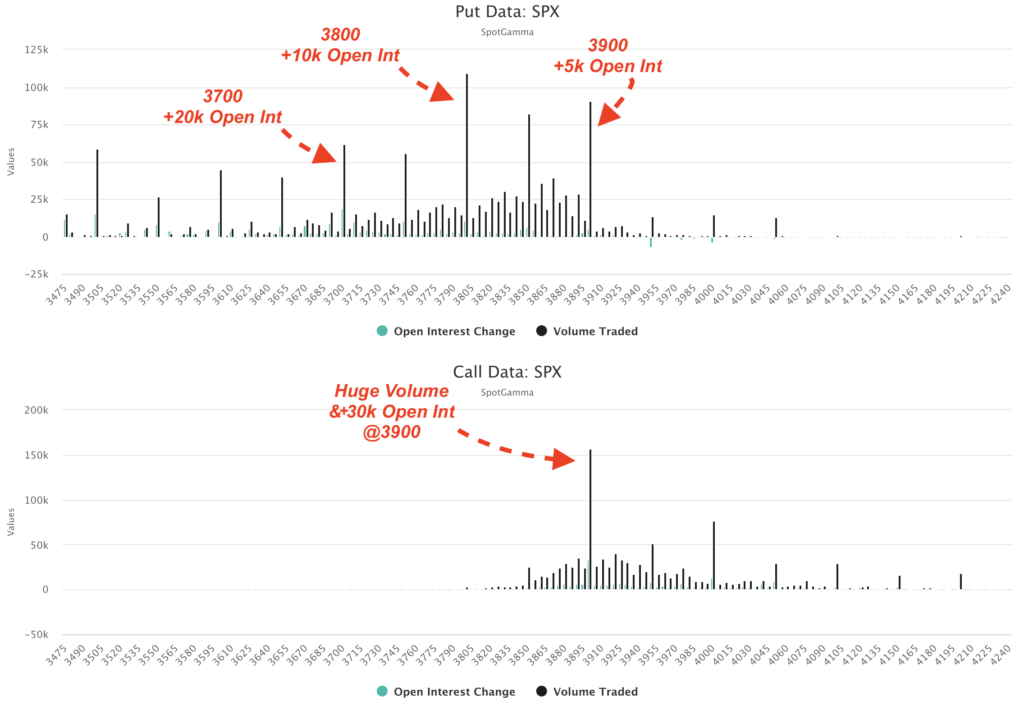
The key thing here is that the Put Walls did not roll lower, which implies that downside put positions did not materially increase. Our view into the weekend was that traders were not positioning on the equity side for “Lehman 2.0”, and that seemed to be the case again, yesterday.
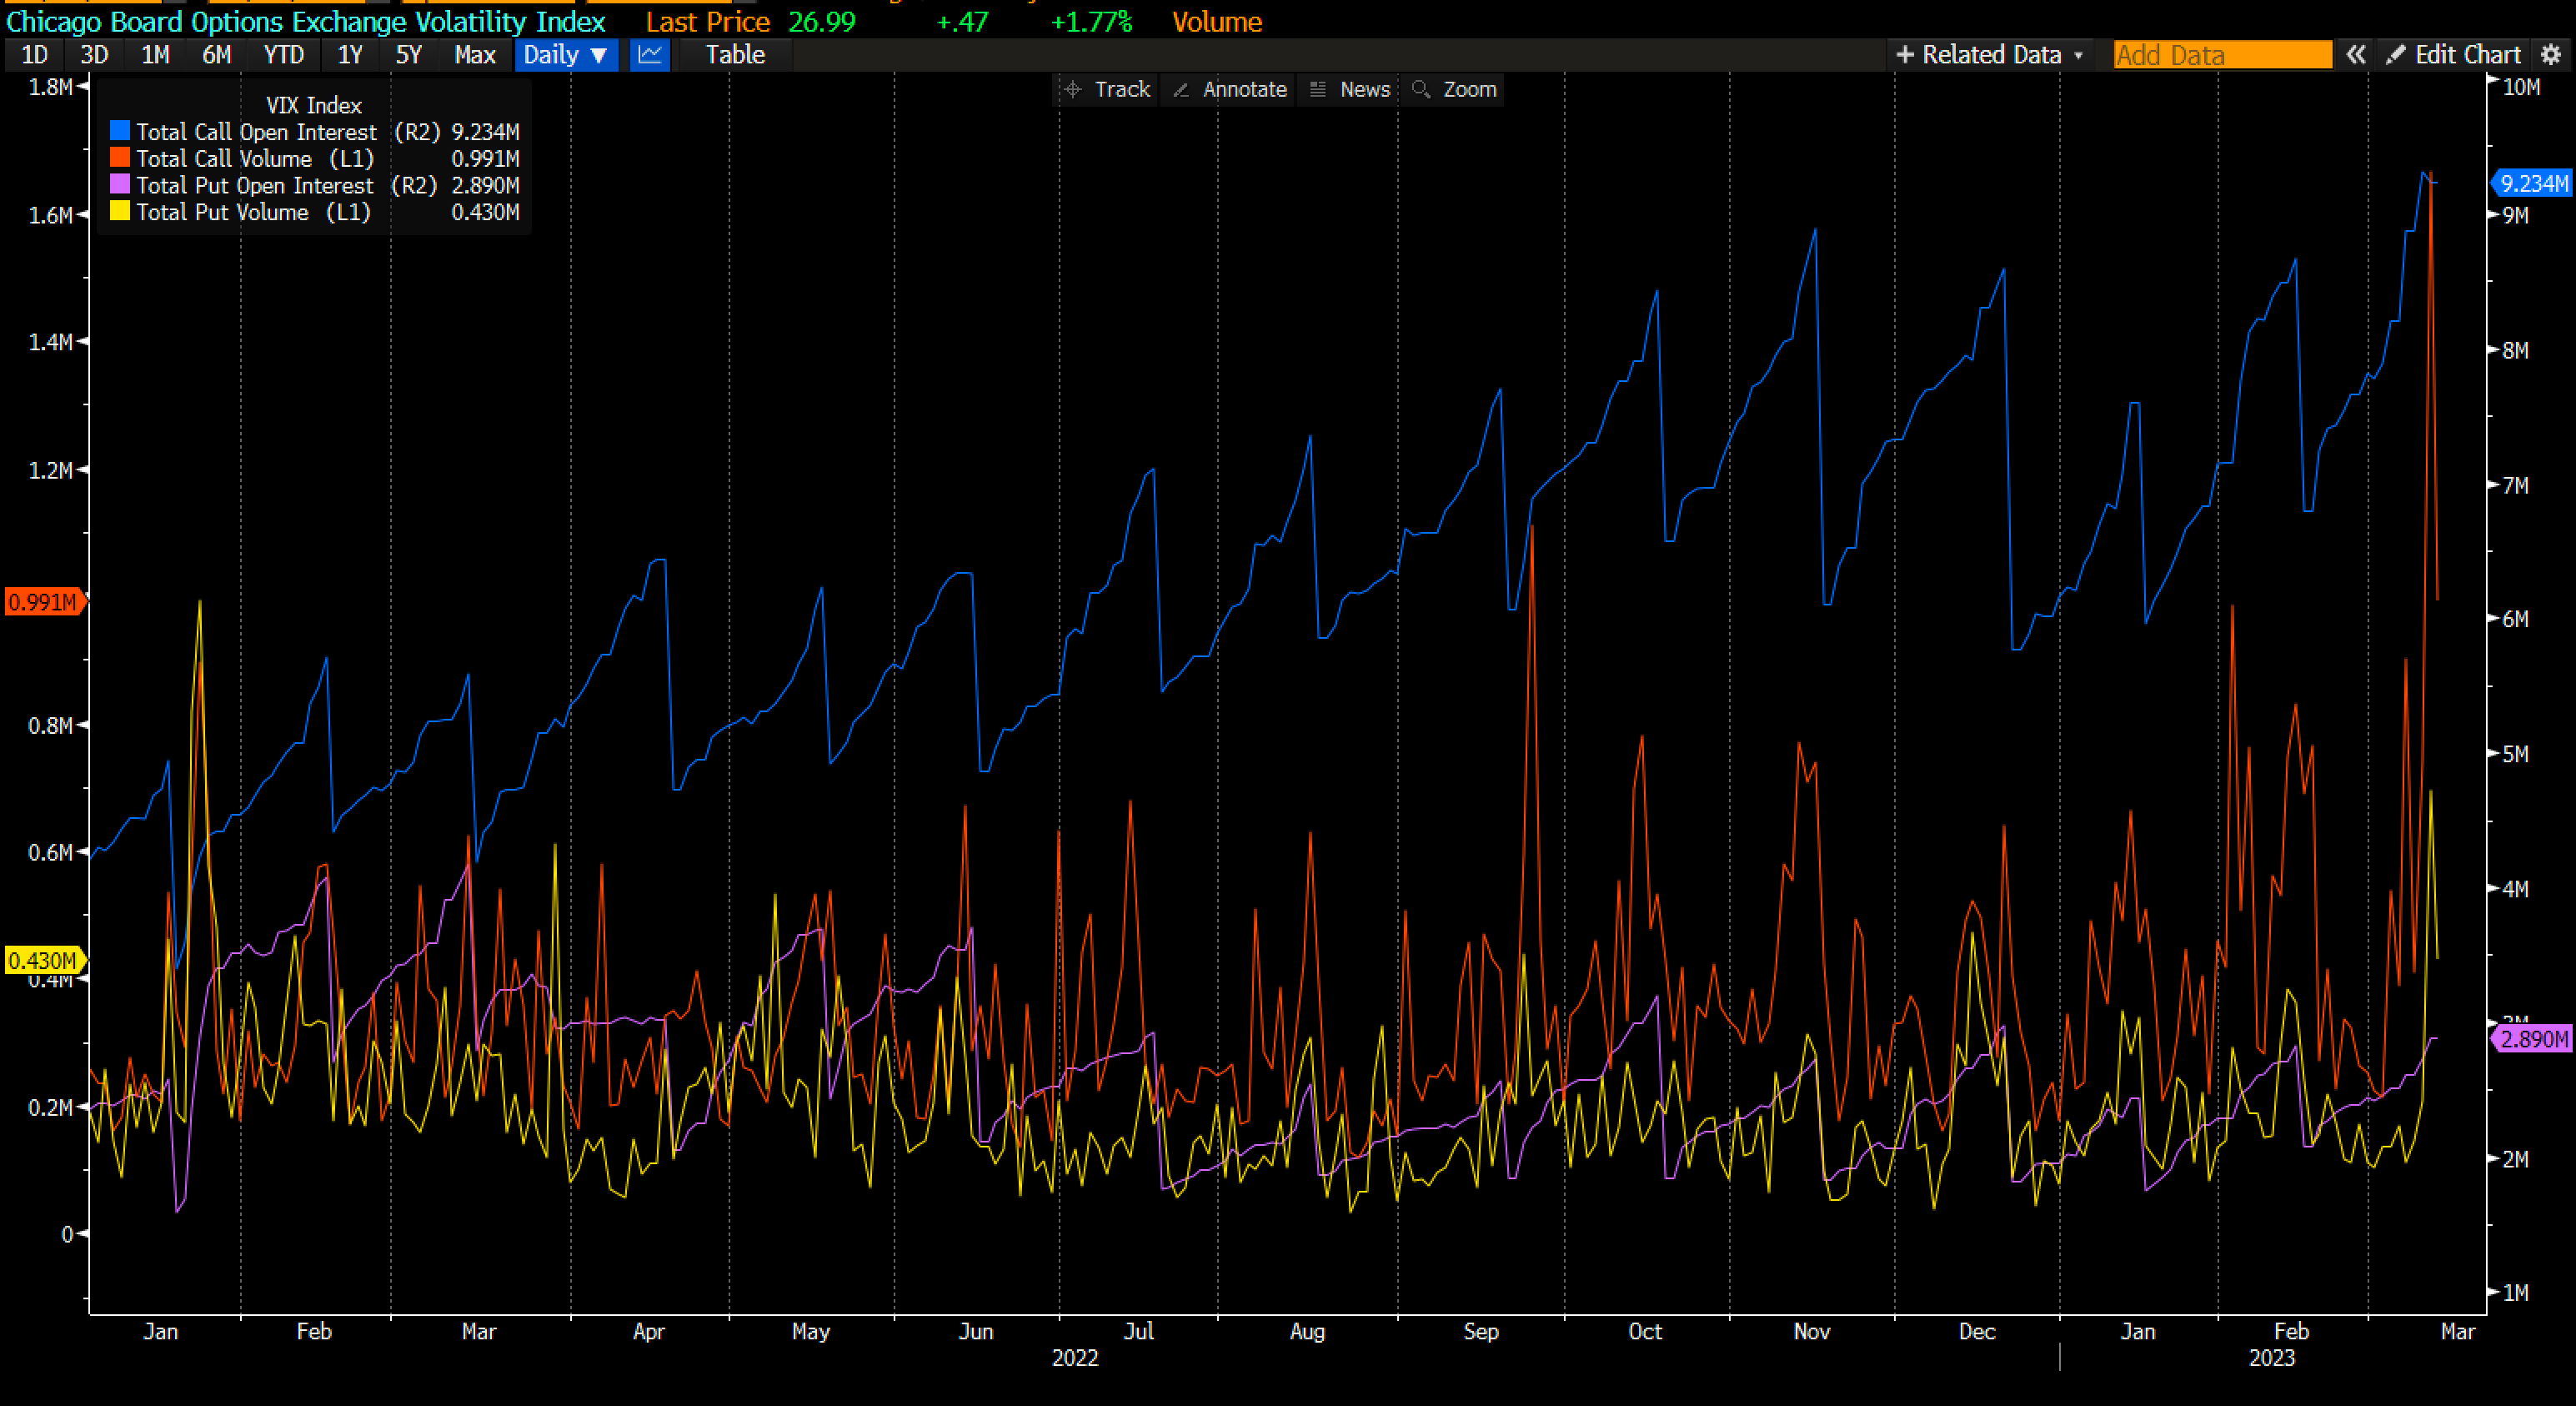
On this point we saw VIX call volumes (red) still high, but down from Friday’s record levels, with no change in call open interest. This record call open interest remains a lurking, convex risk should CPI come in hot and/or bank/credit issues persist. Again we reiterate that this record VIX call positioning (blue) was in place before last weeks SVB crisis. One must therefore see VIX positioning not a function of the crisis – but certainly benefiting from it. Further, a wide swath of this position expires with VIX OPEX on 3/22 (which is coincidentally FOMC day).
New SPX positions established yesterday have also produced this interesting kink in the gamma curve. Whats essentially happened here is that we have two large ranges of open interest: one up near 4000, and a second around 3900. This type of positioning is quite unusual, and we think the result of traders betting on the CPI today through 3900 calls. As a result, we would anticipate this kink dissolving for tomorrow.

The second thing of note here is downside returns. As seen in the plot above, the gamma curve starts to flatten out below 3700 – this implies that dealer hedging flows may stop inducing volatility if the market trades into the 3700 level. Granted this is a full 4% from yesterdays closing price of 3850, but we feel this area is in play into Fridays expiration (particularly with a “hot” CPI).
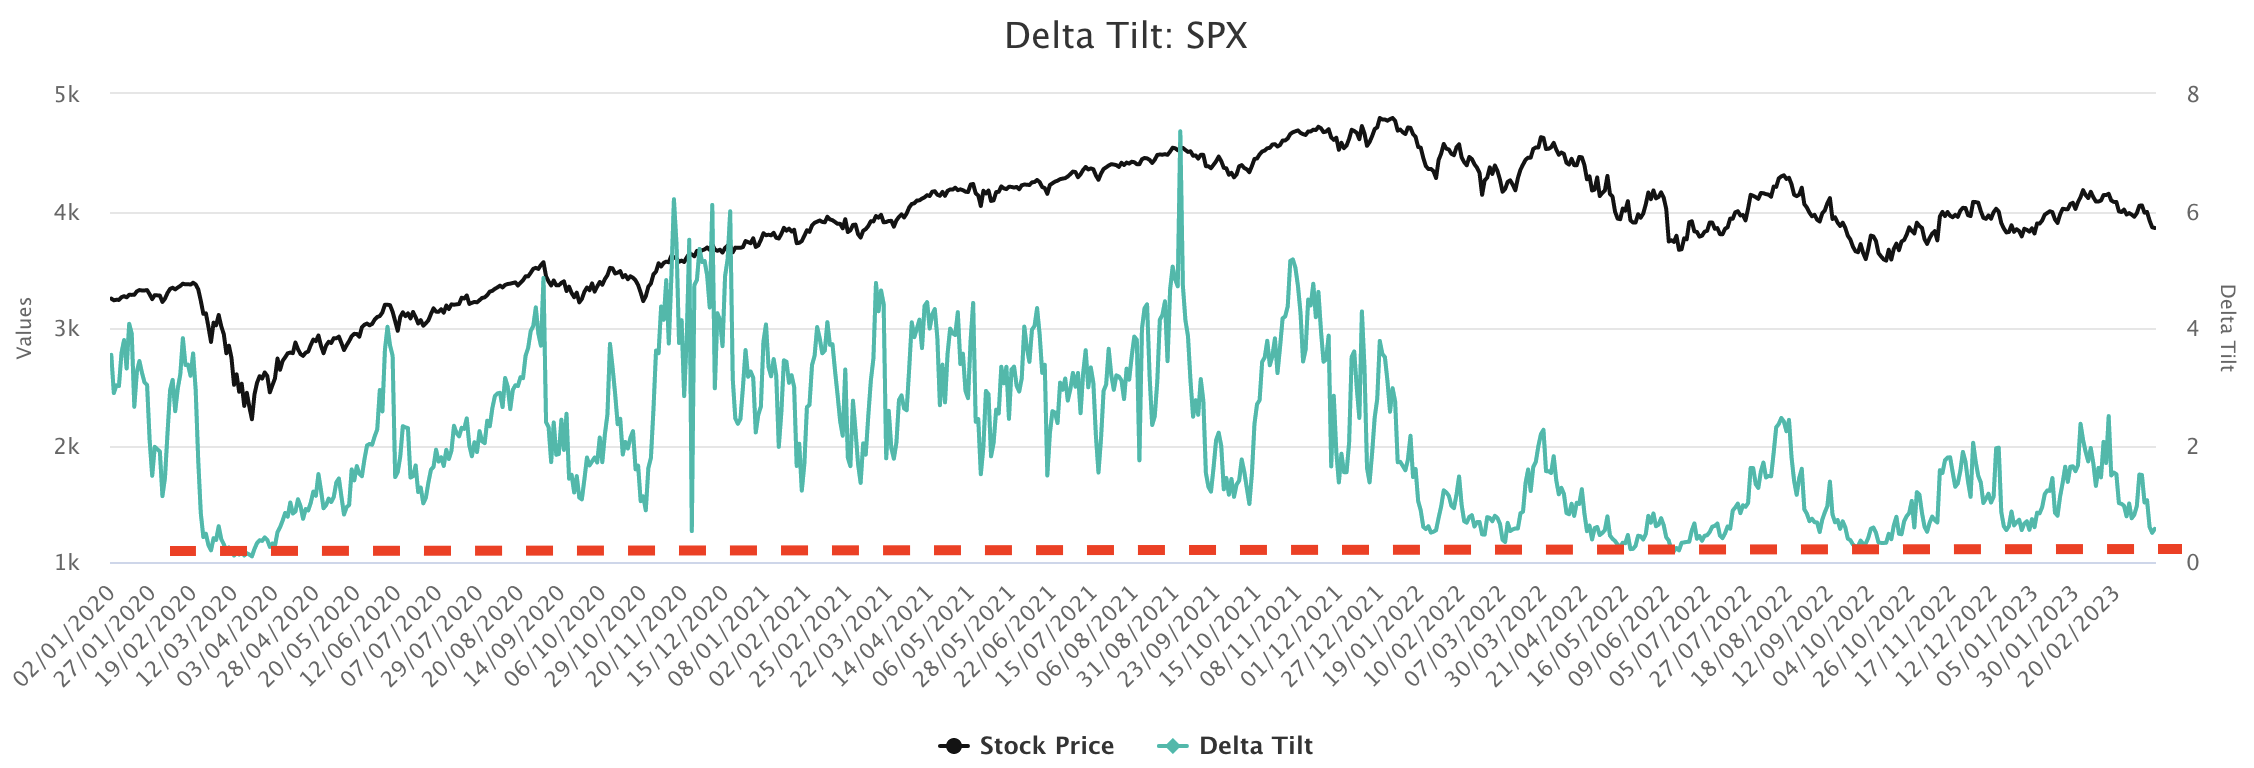
The other models we watch on large downside swings are the Tilt models. These models measure the ratio of put delta: call delta, and as you can see we are currently near a lower bound (red line). This lower bound has been associated with market lows in the past as put positioning hits extremes relative to calls. We flag this as Fridays large expiration will likely remove a lot of the large put positioning reflected in this model, which further implies that markets may bounce higher post-OPEX.
Should markets now rally, we continue to think that 4000 is the upper bound into Fridays expiration. Any move up into that level is likely to be met with heavy call selling, and pinning around that large 4000 gamma strike. This pinning point would then move into a large VIX exp + FOMC on the 22nd which serves as the next catalyst.
| SpotGamma Proprietary SPX Levels | Latest Data | SPX Previous | SPY | NDX | QQQ |
|---|---|---|---|---|---|
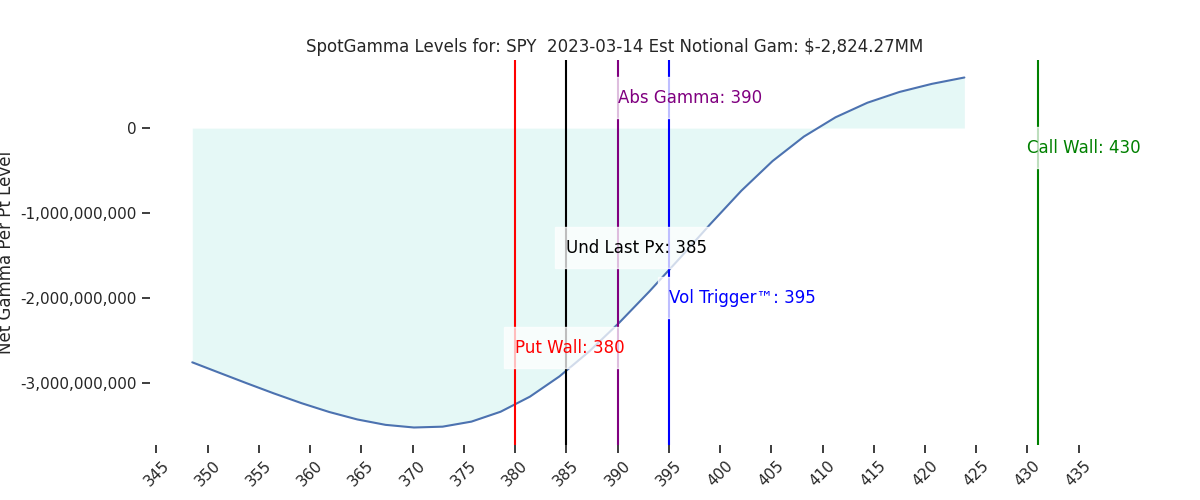
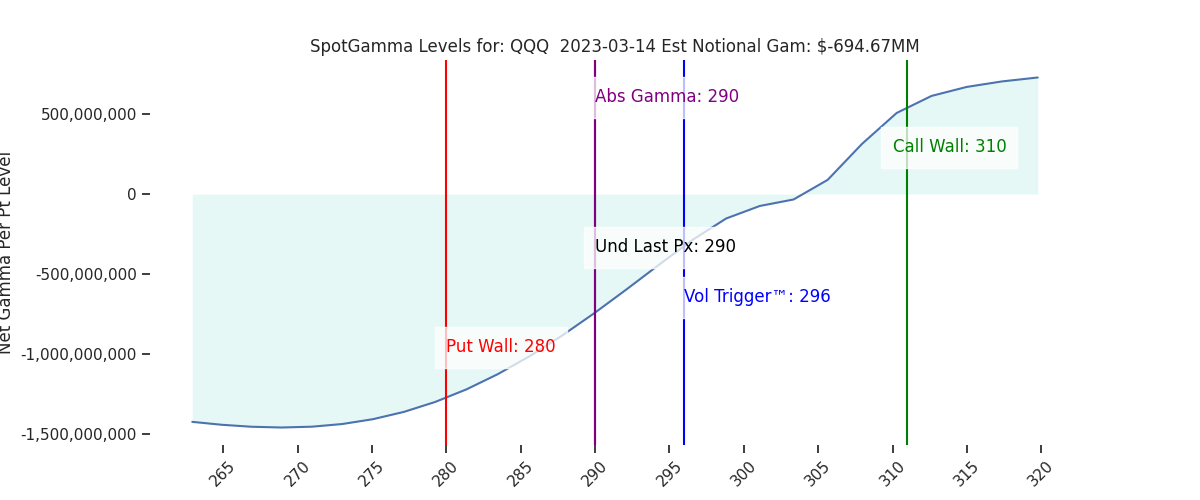
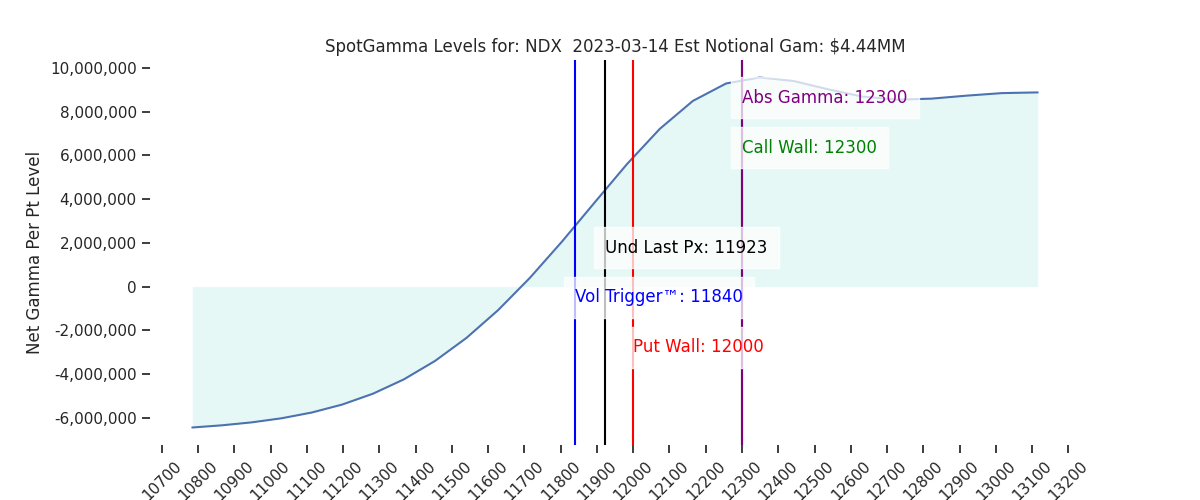
| Reference Price: | 3855 | 3855 | 385 | 11923 | 290 |
| SG Implied 1-Day Move: | 0.97%, | (±pts): 37.0 | VIX 1 Day Impl. Move:1.67% | ||
| SG Implied 5-Day Move: | 2.54% | 3861 (Monday Reference Price) | Range: 3764.0 | 3960.0 | ||
| SpotGamma Gamma Index™: | -1.80 | -2.2 | -0.60 | 0.02 | -0.12 |
| Volatility Trigger™: | 3960 | 4000 | 395 | 11840 | 296 |
| SpotGamma Absolute Gamma Strike: | 4000 | 4000 | 390 | 12300 | 290 |
| Gamma Notional (MM): | -873.0 | -1126.0 | -2824.0 | 4.0 | -695.0 |
| Call Wall: | 4200 | 4200 | 430 | 12300 | 310 |
| Put Wall: | 3800 | 3800 | 380 | 12000 | 280 |
| Additional Key Levels | Latest Data | Previous | SPY | NDX | QQQ |
|---|---|---|---|---|---|
| Zero Gamma Level: | 4050 | 4080 | 408.0 | 11667.0 | 343 |
| Gamma Tilt: | 0.64 | 0.59 | 0.43 | 1.26 | 0.67 |
| Delta Neutral Px: | 3940 | ||||
| Net Delta (MM): | $1,485,498 | $1,580,042 | $225,904 | $52,576 | $107,268 |
| 25 Day Risk Reversal: | -0.05 | -0.05 | -0.06 | -0.04 | -0.05 |
| Call Volume: | 688,690 | 739,107 | 2,553,233 | 8,854 | 1,044,278 |
| Put Volume: | 1,261,221 | 1,706,526 | 4,067,042 | 10,454 | 1,347,413 |
| Call Open Interest: | 6,538,840 | 6,484,319 | 7,017,922 | 68,634 | 5,382,241 |
| Put Open Interest: | 11,145,032 | 11,383,540 | 13,927,969 | 70,176 | 8,529,281 |
| Key Support & Resistance Strikes: |
|---|
| SPX: [4000, 3950, 3900, 3850] |
| SPY: [400, 390, 385, 380] |
| QQQ: [300, 290, 285, 280] |
| NDX: [12300, 12000, 11750, 11500] |
| SPX Combo (Strike, Percentile): [(3948.0, 91.47), (3902.0, 83.28), (3898.0, 97.78), (3890.0, 76.5), (3875.0, 80.89), (3871.0, 86.41), (3852.0, 97.28), (3825.0, 90.78), (3821.0, 76.14), (3813.0, 76.3), (3802.0, 99.5), (3775.0, 88.1), (3763.0, 76.52), (3752.0, 98.23), (3725.0, 82.47), (3702.0, 98.96), (3675.0, 82.03)] |
| SPY Combo: [379.92, 369.9, 374.91, 389.55, 384.92] |
| NDX Combo: [12305.0, 11482.0, 11685.0, 11899.0] |