Futures are down 0.4% to 4370, but up from overnight lows of 4355. We forecast relatively high volatility for today, with an SG implied move of 1.17%. Resistance is at 4400SPX & 4420 (SPY440). Support shows at 4355 (SPY435) then 4300. Risk remains elevated as long as the market is under 4400.
Last week we believed that the market was being supported by the expiration of fairly large April put positions, heavily concentrated at the 440SPY/4400SPX level. With that, the S&P made a few attempts at 4450, but is now poised to open below the key 4400 strike.
The supportive hedging flows (short covering due to puts expiring) are now gone, with the next major expiration a full 4 weeks out. Further, there is a FOMC meeting on May 4th which will likely lead to traders holding hedge protection which keeps a bit to implied volatility (i.e. VIX). As a result, the “positional” tailwinds offered by the options market are now reduced because put-decay is low, and there isn’t a near term catalyst to sell implied volatility.
Despite Friday’s OPEX clearing out some open interest, this market is still dominated by puts. As such, volatility should remain high due to negative gamma hedging. Further, as implied volatility shifts around this compounds flows, due to put-hedging requirements (higher IV = more short hedging pressure, lower IV = buying pressure).
To this point, below is our view of gamma by strike ranked as a percentile. You can see there are a number of high put strikes (red), with very little on the call side.
This is a similar situation in SPY, too. If you look at the distribution of positions in SPY below, you can see that <=440 its pure put gamma which infers elevated volatility and higher risk. If markets can regain 440 that should lead to a reduction in both volatility & risk.

There are two interesting features to this market. First, the size of puts is not particularly large, its just that its large relative to calls. There was an interesting article on Reuters discussing this relationship, wherein a commentator pointed out a heavy 2.5PC ratio in SPY. This ratio is a function of a decrease in call demand, and not an increase in put demand.
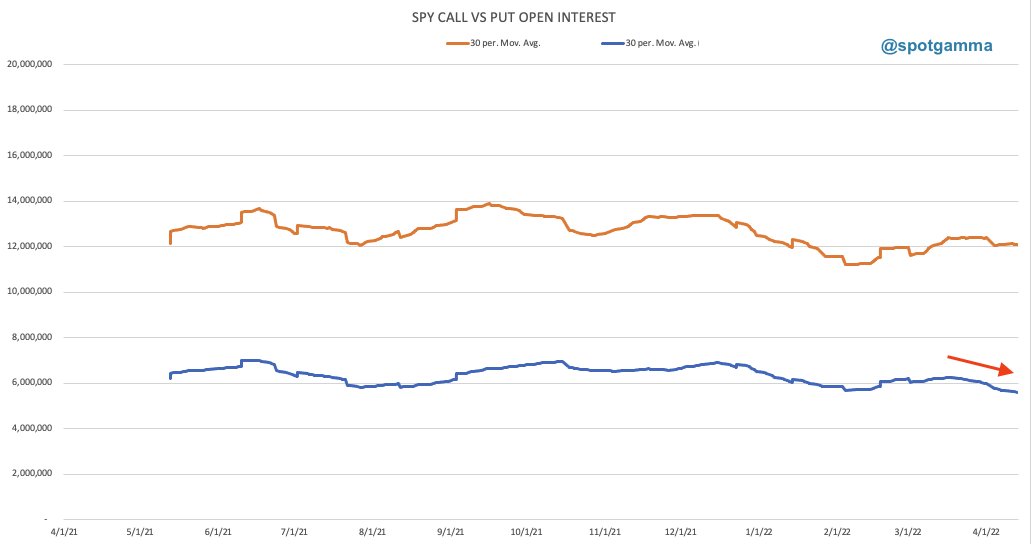
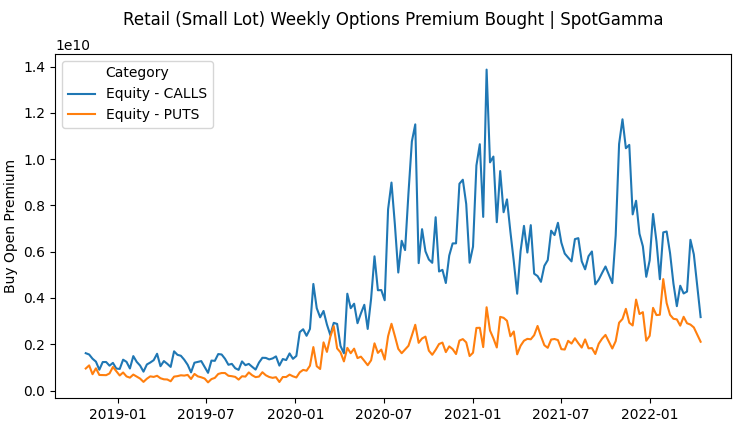
Similarly much has been made over the last several years on “retail call demand”. Below is data we compile from the OCC, and it shows that call demand is now at ~2year lows. This leads to our second key point: it appears there is a “deleveraging” of sorts in the options complex.
If you look at the SPY options complex you can clearly see how we’ve arrived at this view. SPY options volumes are declining sharply from mid-March highs, with call open interest(red) near 7 year lows! However, note put interest (dark blue) – its not far off of lows, either. (Note: SPX is average across the board).
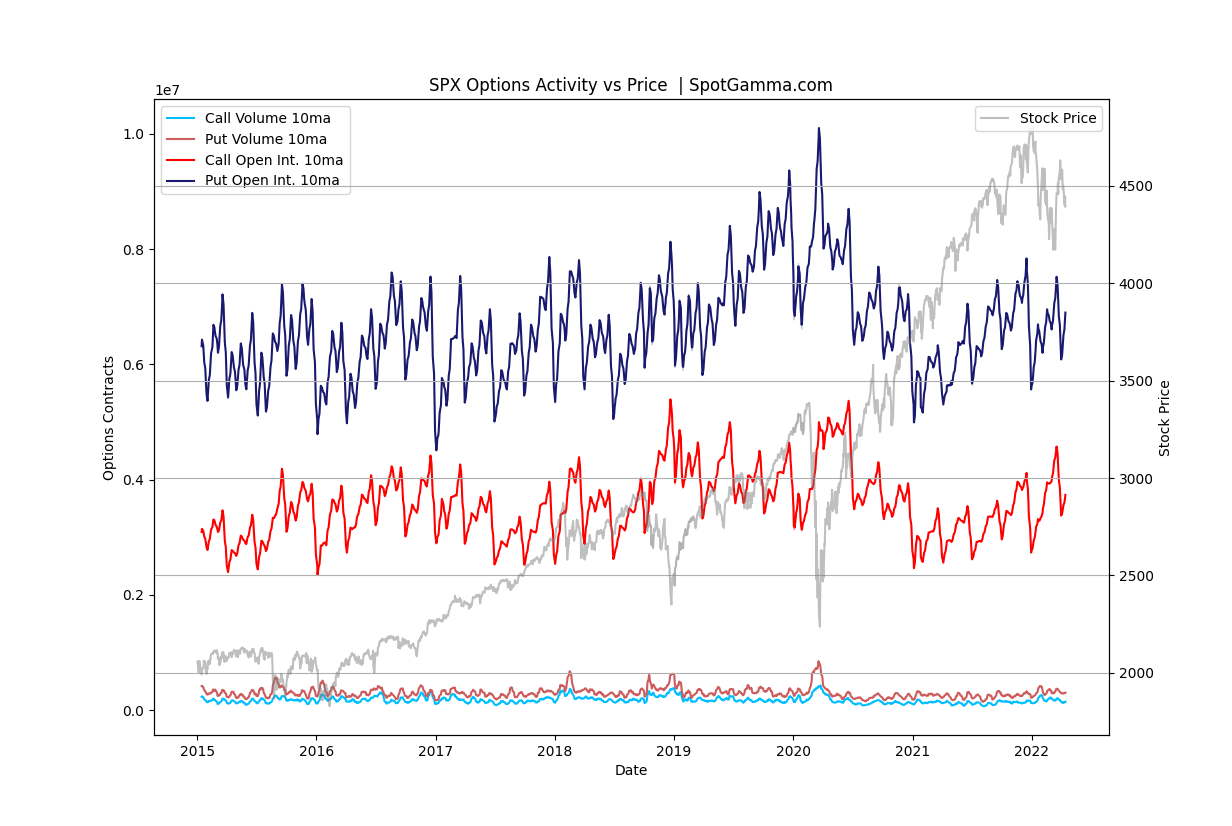

A caveat to this is in QQQ. While we’d note that the QQQ size here carries one less digit than SPY, you can clearly see that both put (dark blue) and call(red) open interest in QQQ is at highs. This also goes for put (magenta) and call (light blue) volumes. This suggests that QQQ is the “weapon of choice” for expressing equity downside, which is likely tied more to fundamental views (i.e. impact of higher rates) than “hedging tails”.

Our belabored point here is that while markets are rather one-sidedly positioned in put options, its not an impressively large position. Traders deleveraged after the March OPEX, but there has been no attempt to position into calls (or puts) even with the ~10% end of March rally. Further, we do not see a catalyst for call buyers or put closing until either 1) rate clarity or 2) a geopolitical resolution.
Neither appear imminent, and so we look for high volatility to remain, which leads to large directional swings in markets. As always, we give a bullish edge to stocks if the S&P can recover the Vol Trigger, which stands at 4450.
As for today, we see risk as particularly elevated as long as the S&P is under 4400. This is due to the put-heavy positioning under that strike, as an increase in implied volatility could lead to a sharp gap lower to 4300.
| SpotGamma Proprietary Levels | Latest Data | Previous | SPY | NDX | QQQ |
|---|---|---|---|---|---|
| Ref Price: | 4392 | 4392 | 437 | 13893 | 338 |
| SpotGamma Imp. 1 Day Move: Est 1 StdDev Open to Close Range |
1.17%, | (±pts): 51.0 | VIX 1 Day Impl. Move:1.42% | ||
| SpotGamma Imp. 5 Day Move: | 2.91% | 4392 (Monday Ref Px) | Range: 4265.0 | 4520.0 | ||
| SpotGamma Gamma Index™: | -1.07 | -1.07 | -0.33 | 0.01 | -0.15 |
| Volatility Trigger™: | 4450 | 4450 | 442 | 14025 | 345 |
| SpotGamma Absolute Gamma Strike: | 4400 | 4400 | 430 | 14050 | 340 |
| Gamma Notional(MM): | -538.0 | -537.85 | -1452.0 | 0.0 | -895.0 |
| Additional Key Levels | Latest Data | Previous | SPY | NDX | QQQ |
|---|---|---|---|---|---|
| Zero Gamma Level: | 4487 | 4487 | 0 | 0 | 0 |
| Put Wall Support: | 4300 | 4300 | 430 | 14000 | 335 |
| Call Wall Strike: | 4750 | 4750 | 480 | 14050 | 352 |
| CP Gam Tilt: | 0.7 | 0.68 | 0.5 | 1.02 | 0.46 |
| Delta Neutral Px: | 4470 | ||||
| Net Delta(MM): | $1,352,538 | $1,352,538 | $150,768 | $39,960 | $99,787 |
| 25D Risk Reversal | -0.07 | -0.08 | -0.08 | -0.1 | -0.09 |
| Call Volume | 355,435 | 1,067,015 | 14,141 | 769,273 | |
| Put Volume | 811,700 | 2,025,394 | 14,104 | 1,130,613 | |
| Call Open Interest | 4,241,833 | 4,824,263 | 40,903 | 2,969,318 | |
| Put Open Interest | 8,796,522 | 9,515,354 | 44,067 | 6,105,501 |
| Key Support & Resistance Strikes: |
|---|
| SPX: [4500, 4450, 4400, 4300] |
| SPY: [450, 440, 435, 430] |
| QQQ: [350, 340, 335, 330] |
| NDX:[15000, 14500, 14050, 14000] |
| SPX Combo (strike, %ile): [4300.0, 4349.0, 4401.0, 4314.0, 4366.0] |
| SPY Combo: [428.6, 433.41, 438.67, 429.91, 435.16] |
| NDX Combo: [13754.0, 13963.0, 13546.0, 14046.0, 13879.0] |


