
Status quo after a failure to test far into Tuesday’s trading range which was characterized by steady, liquidation-type, selling, as alluded to in the morning note.
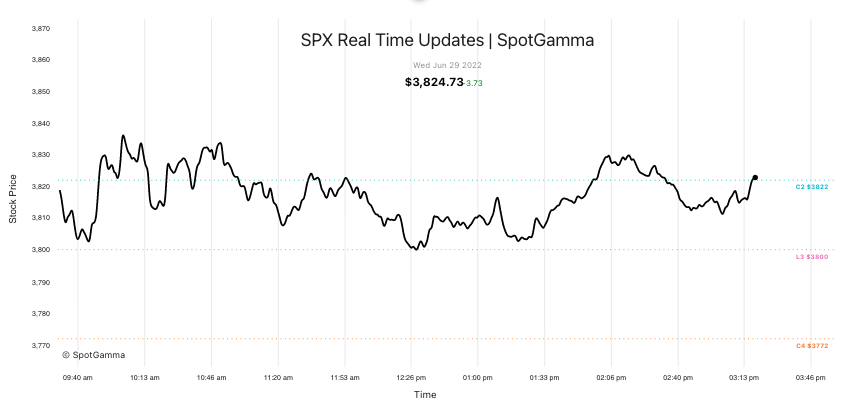
For the majority of Wednesday’s session, the SPX traded responsively above our $3,800.00 support provided to subscribers this morning.
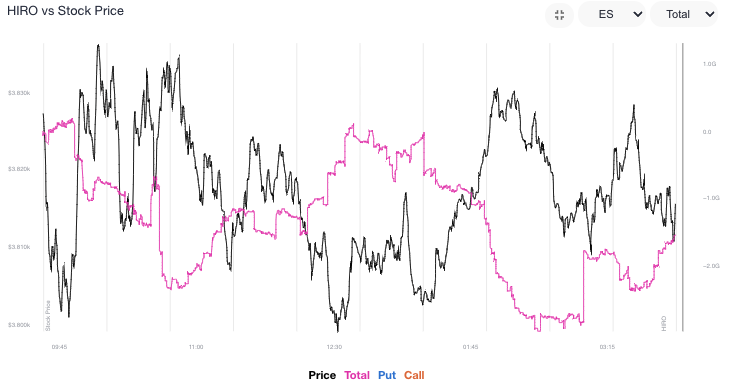
Noteworthy is HIRO’s predictive power during recent trade.
Often, HIRO signals will precede reversals in either direction. Last night, we talked about the volatility selling (call and put side), and the liquidity providers’ likely response to that activity.
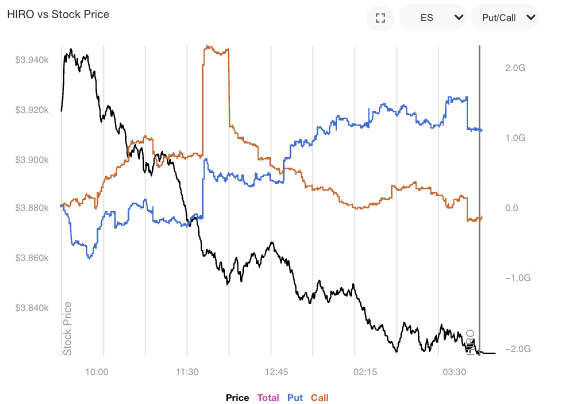
All else equal, this response tends toward taking from realized volatility (as liquidity provider sells into strength or buys into weakness to hedge increased directional exposure), precisely along the lines of what we saw, today.
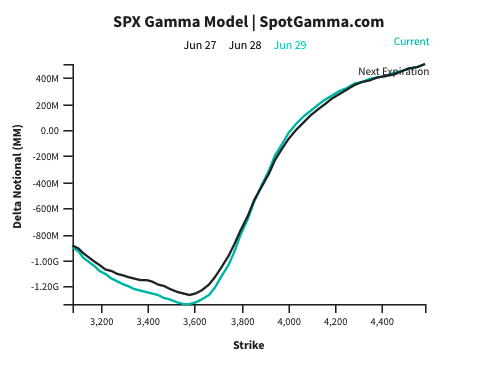
In regards to positioning at a higher level, S&P 500 gamma flipped negative after a breach of our $3,910.00 volatility trigger, yesterday. It is below this level that liquidity providers’ exposure to put options solicits increased hedging activities which may add pressure to the underlying.
Accordingly, after the breach, the S&P 500 slid lower, quickly, before, ultimately, finding support at our $3,800.00 SPX ($380.00 SPY), which is a Put Wall, the strike at which there is a large concentration of customer exposure to puts.
Moreover, a feature of unsustainable rallies, in recent months, has been the selling of puts and little demand for calls. That still seems to have been the case this time around.
So, if selling were to continue, at $3,600.00 SPX we see liquidity provider hedging pressure leveling off. In other words, there, all else equal, we would expect to see a bounce.
| SpotGamma Proprietary SPX Levels | Latest Data | SPX Previous | SPY | NDX | QQQ |
|---|---|---|---|---|---|
| Ref Price: | 3812 | 3821 | 380 | 11659 | 283 |
| SpotGamma Imp. 1 Day Move: Est 1 StdDev Open to Close Range |
1.25%, | (±pts): 48.0 | VIX 1 Day Impl. Move:1.77% | ||
| SpotGamma Imp. 5 Day Move: | 2.84% | 3912 (Monday Ref Px) | Range: 3801.0 | 4023.0 | ||
| SpotGamma Gamma Index™: | -1.26 | -1.27 | -0.29 | 0.01 | -0.09 |
| Volatility Trigger™: | 4000 | 4000 | 386 | 11070 | 291 |
| SpotGamma Absolute Gamma Strike: | 4000 | 4000 | 380 | 11150 | 300 |
| Gamma Notional(MM): | -751.0 | -711.3 | -1429.0 | 1.0 | -596.0 |
| Additional Key Levels | Latest Data | Previous | SPY | NDX | QQQ |
|---|---|---|---|---|---|
| Zero Gamma Level: | 4002 | 4011 | 0 | 0 | 0 |
| Put Wall Support: | 3700 | 3700 | 380 | 10500 | 280 |
| Call Wall Strike: | 4300 | 4300 | 396 | 11150 | 292 |
| CP Gam Tilt: | 0.62 | 0.6 | 0.55 | 1.16 | 0.65 |
| Delta Neutral Px: | 4076 | ||||
| Net Delta(MM): | $1,524,364 | $1,527,942 | $169,866 | $52,395 | $102,058 |
| 25D Risk Reversal | -0.07 | -0.07 | -0.05 | -0.07 | -0.07 |
| Call Volume | 488,907 | 488,907 | 2,947,743 | 6,644 | 1,068,117 |
| Put Volume | 772,598 | 772,598 | 3,769,090 | 7,816 | 1,184,836 |
| Call Open Interest | 5,602,224 | 5,602,224 | 7,064,868 | 59,883 | 4,542,129 |
| Put Open Interest | 9,670,073 | 9,670,073 | 10,734,835 | 54,766 | 6,510,836 |
| Key Support & Resistance Strikes: |
|---|
| SPX: [4000, 3900, 3800, 3750] |
| SPY: [385, 380, 375, 370] |
| QQQ: [300, 290, 285, 280] |
| NDX:[12500, 12000, 11250, 11150] |
| SPX Combo (strike, %ile): [3796.0, 3746.0, 3899.0, 3811.0, 3712.0] |
| SPY Combo: [378.08, 373.13, 388.35, 379.6, 369.71] |
| NDX Combo: [11519.0, 11717.0, 11426.0] |


