
Futures are down sharply to 3760 as we close out the 1st half of 2022. Resistance shows at 3800 then 3855 (SPY 385). Support shows at 3750 & 3700.
There are a lot of large flows in the market today, not just from the JPM roll but likely, too, from macro rebalancing (due to quarter end). We therefore see little directional edge today, but continue to think that quarter end has opened the window for further downside into July. This is a function of put support rolling to lower strikes. We look for the Put Wall (3700) to be rolled lower as a key signal that more downside is ahead.
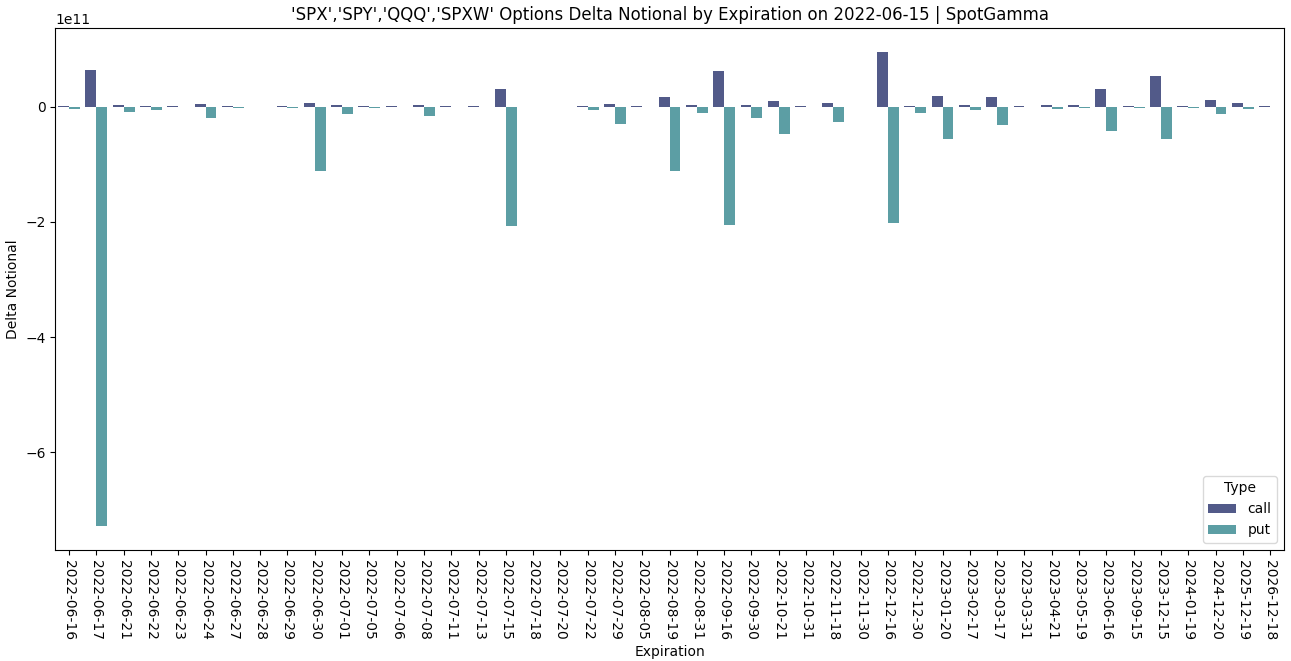
Our models estimate 5-10% of S&P delta expiring today which is driven by that deep ITM4285 put that JPM owns and expires today. While this is a large position, its a singular position and in total this expiration pales in comparison to June 17th OPEX. You an see this in the plot below, wherein we plot raw delta for puts (teal) and calls (navy). 6/30 expiration is smaller than that of July 15th which is a regular monthly expiration (compare it to the June OPEX chart here). See Tuesday AM’s note herefor more on how this JPM roll may have impacted markets.

Looking forward the major downside area we continue to watch is the Feb’ 20 high (~10% from here), and interestingly the new JPMstrikes will likely be around this area. This could be a place to mark as important longer term support.

To the upside 4000 is the major strike to watch due to large open interest. We believe that the market cannot hold a sustained rally without more clarity from the Fed which likely comes with a more definitive pause/reduction in inflation. With that we want to see larger call positions added as puts are closed – something that our models have not seen of late. We will therefore be looking at major Fed meetings + expirations as areas to position for rallies. One of these windows seems to be late July.
| SpotGamma Proprietary SPX Levels | Latest Data | SPX Previous | SPY | NDX | QQQ |
|---|---|---|---|---|---|
| Ref Price: | 3818 | 3812 | 380 | 11658 | 283 |
| SpotGamma Imp. 1 Day Move: Est 1 StdDev Open to Close Range |
1.28%, | (±pts): 49.0 | VIX 1 Day Impl. Move:1.77% | ||
| SpotGamma Imp. 5 Day Move: | 2.84% | 3912 (Monday Ref Px) | Range: 3801.0 | 4023.0 | ||
| SpotGamma Gamma Index™: | -1.11 | -1.26 | -0.27 | 0.01 | -0.08 |
| Volatility Trigger™: | 3910 | 4000 | 385 | 11070 | 285 |
| SpotGamma Absolute Gamma Strike: | 4000 | 4000 | 380 | 11150 | 300 |
| Gamma Notional(MM): | -601.0 | -751.11 | -1254.0 | 2.0 | -511.0 |
| Additional Key Levels | Latest Data | Previous | SPY | NDX | QQQ |
|---|---|---|---|---|---|
| Zero Gamma Level: | 3978 | 4002 | 0 | 0 | 0 |
| Put Wall Support: | 3700 | 3700 | 380 | 10500 | 280 |
| Call Wall Strike: | 4300 | 4300 | 390 | 11150 | 292 |
| CP Gam Tilt: | 0.66 | 0.58 | 0.57 | 1.16 | 0.69 |
| Delta Neutral Px: | 4052 | ||||
| Net Delta(MM): | $1,506,455 | $1,524,364 | $154,677 | $52,334 | $101,304 |
| 25D Risk Reversal | -0.06 | -0.07 | -0.04 | -0.07 | -0.07 |
| Call Volume | 494,986 | 488,907 | 1,824,615 | 3,631 | 778,665 |
| Put Volume | 730,928 | 772,598 | 2,141,650 | 3,363 | 954,611 |
| Call Open Interest | 5,769,499 | 5,602,224 | 7,044,537 | 60,129 | 4,611,414 |
| Put Open Interest | 9,634,409 | 9,670,073 | 10,193,594 | 54,813 | 6,465,470 |
| Key Support & Resistance Strikes: |
|---|
| SPX: [4000, 3900, 3800, 3750] |
| SPY: [385, 380, 375, 370] |
| QQQ: [300, 290, 285, 280] |
| NDX:[12500, 12000, 11250, 11150] |
| SPX Combo (strike, %ile): [3796.0, 3746.0, 3899.0, 3811.0, 3712.0] |
| SPY Combo: [378.08, 373.13, 388.35, 379.6, 369.71] |
| NDX Combo: [11507.0, 11425.0, 11996.0] |


