
Futures are flat overnight to 3970 after yesterdays big rally. Resistance remains at the 4000-4020 (SPY 402 Call Wall) area, which also contains the 4005 SPX Call Wall. Support is from 3960(SPY395) to 3950, followed by 3910 (SPY390).
Powell speaks this morning at 9AM, and we view this as a rather short term catalyst. As we outlined yesterday, the big triggers fall next week with CPI, OPEX then FOMC.
The notable flow from yesterday was SPY ATM calls which were sold into the rally. This generated some rather large negative deltas which played into the market rally. On net, yesterdays options flow had little impact on our key levels. The 4000-4020 area remains a thick band of resistance as shown below. The SPY Put Wall shifts back to 390 – in sync with 3900 SPX Put Wall support.

While markets are under this 4000 line, puts remain in control. This implies markets are prone to large, volatile swings. This stance is indicated by the vanna model posted below. The tilt of this model suggests that as implied volatility declines + market rallies dealers will be buying back futures. Conversely declines in the market + higher IV leads to selling futures. Note that in call dominated markets this model is the mirror opposite.
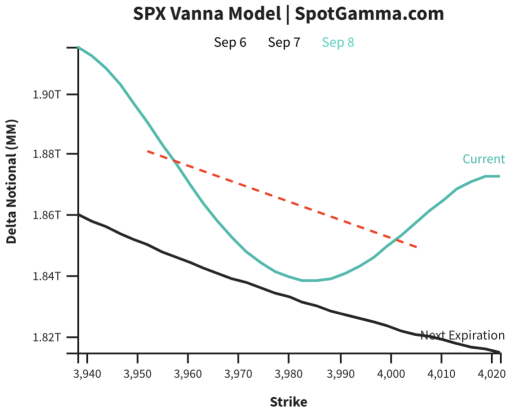
While traders may be taking a shot at selling short dated IV, there will not likely be wholesale vol selling until we move through some of these macro datapoints (listed above). This suggests we can get short, violent rallies like yesterday – but those are subject to fast reversals.
However, if the next several events (CPI, FOMC) prove to be market friendly that will trigger heavy put/vol selling which combines with the large, put-heavy Sep 16th OPEX. This is the type of set that can lead to 5-10% equity rallies (like March & June OPEX).
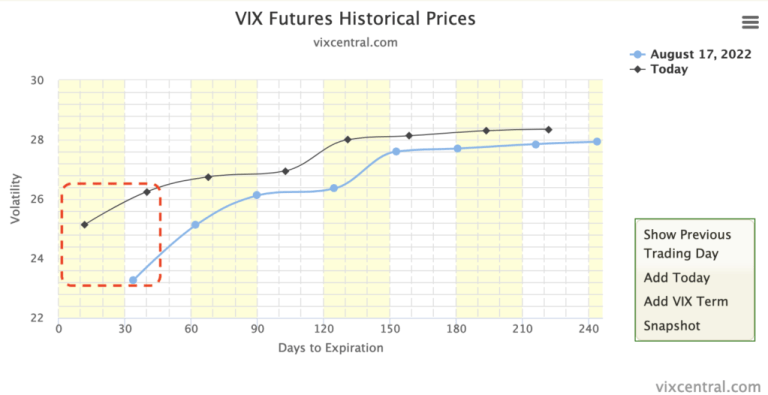
Below is the VIX term structure for August 17th vs today. August 17th was the recent SPX high of 4300 (that high timed to Aug OPEX). With positive data points this spread could collapse into the end of September which is a boost for equities.
For those that want to play rallies, you should be cognizant of this implied volatility decline which can be a drag on call values. Consider more ATM calls and/or call spreads to help offset that IV decline which is linked to rallies.
On the put side the story remains the same. There is no real grab for put insurance and we do not anticipate any major uptick in demand unless there is a material, macro trigger.
| SpotGamma Proprietary SPX Levels | Latest Data | SPX Previous | SPY | NDX | QQQ |
|---|---|---|---|---|---|
| Ref Price: | 3980 | 3980 | 397 | 12259 | 298 |
| SG Implied 1-Day Move:: | 0.99%, | (±pts): 39.0 | VIX 1 Day Impl. Move:1.56% | ||
| SG Implied 5-Day Move: | 2.92% | 3925 (Monday Ref Price) | Range: 3811.0 | 4040.0 | ||
| SpotGamma Gamma Index™: | -0.55 | -1.4 | -0.28 | -0.01 | -0.14 |
| Volatility Trigger™: | 3950 | 4000 | 400 | 12850 | 300 |
| SpotGamma Absolute Gamma Strike: | 4000 | 4000 | 400 | 12500 | 300 |
| Gamma Notional(MM): | -484.0 | -445.0 | -1452.0 | -1.0 | -965.0 |
| Put Wall: | 3900 | 3900 | 390 | 11000 | 290 |
| Call Wall : | 4005 | 4005 | 402 | 13250 | 305 |
| Additional Key Levels | Latest Data | Previous | SPY | NDX | QQQ |
|---|---|---|---|---|---|
| Zero Gamma Level: | 4079 | 4079 | 409.0 | 12321.0 | 323 |
| CP Gam Tilt: | 0.87 | 0.8 | 0.63 | 0.92 | 0.53 |
| Delta Neutral Px: | 4067 | ||||
| Net Delta(MM): | $1,780,176 | $1,814,050 | $201,864 | $53,822 | $114,417 |
| 25D Risk Reversal | -0.07 | -0.08 | -0.07 | -0.08 | -0.08 |
| Call Volume | 516,002 | 495,296 | 1,860,010 | 6,441 | 787,889 |
| Put Volume | 787,158 | 867,665 | 2,762,457 | 6,964 | 1,034,166 |
| Call Open Interest | 6,345,206 | 6,240,514 | 7,532,435 | 66,502 | 4,581,735 |
| Put Open Interest | 11,098,748 | 10,936,146 | 13,005,752 | 82,627 | 7,662,000 |
| Key Support & Resistance Strikes: |
|---|
| SPX: [4100, 4000, 3950, 3900] |
| SPY: [400, 395, 390, 380] |
| QQQ: [310, 300, 295, 290] |
| NDX:[13250, 13000, 12500, 12000] |
| SPX Combo (strike, %ile): [3900.0, 4004.0, 3948.0, 4024.0, 4000.0] |
| SPY Combo: [389.82, 400.17, 394.6, 402.16, 399.77] |
| NDX Combo: [12296.0, 12100.0, 12223.0] |


