
Futures have pressed higher to 4050. As this level is above our 4005 SPX Call Wall, we consider the market overbought. We see no significant resistance lines above until 4100. Support lies at 4005-4000 band followed by 3950.
As futures are back above 4000 our models shift to a bullish stance, however not having many resistance levels above is quite unique. This is a reflection of 4000-4100 being a zone with very light positions which in turn makes this zone fluid for price action (no pinning). This is further indicated by the spread between our Vol Trigger and Zero Gamma lines (4000 vs 4044), and the somewhat rapid movement or flickering of these levels (20-50 pt changes overnight). This comes from no sticky, large OI areas.
Simply put: the index/etf options market does not seem to have much going on above, as shown.

The other unique think here is the kink in our gamma curve, as shown on the right. This kink was not there yesterday (left image), and based on the difference between today’s model (teal) and tomorrows (black) it appears many short dated positions are set to expire. We also noted 150k 4000 strike SPX calls & 600k 400 strike SPY calls traded yesterday – but little to no change in open interest at those lines.
There was certainly a lot of volatility yesterday which plays into that volume – but one gets the idea of heavy short term daytrading/momentum type flow is at work here. Its like a bear “sucker punch”.

While the positioning above is light & transient – implied volatility appears to be under heavy pressure. This is reflected in our Risk Reversal metric, wherein a -0.05 reading generally comes with bullish, call-bid markets. The high signal here is likely sourced from selling puts vs increased call demand. This plays into higher vol-of-vol (faster moves) – moves up overextend as vol gets crushed while in a negative gamma position.

Further, there is a pull-forward of negative delta fuel from next Fridays large OPEX (i.e. put decay is fueling volatility). This is shown below where the delta size expiring for Sep OPEX is now ~50% vs a last Friday(chart here).
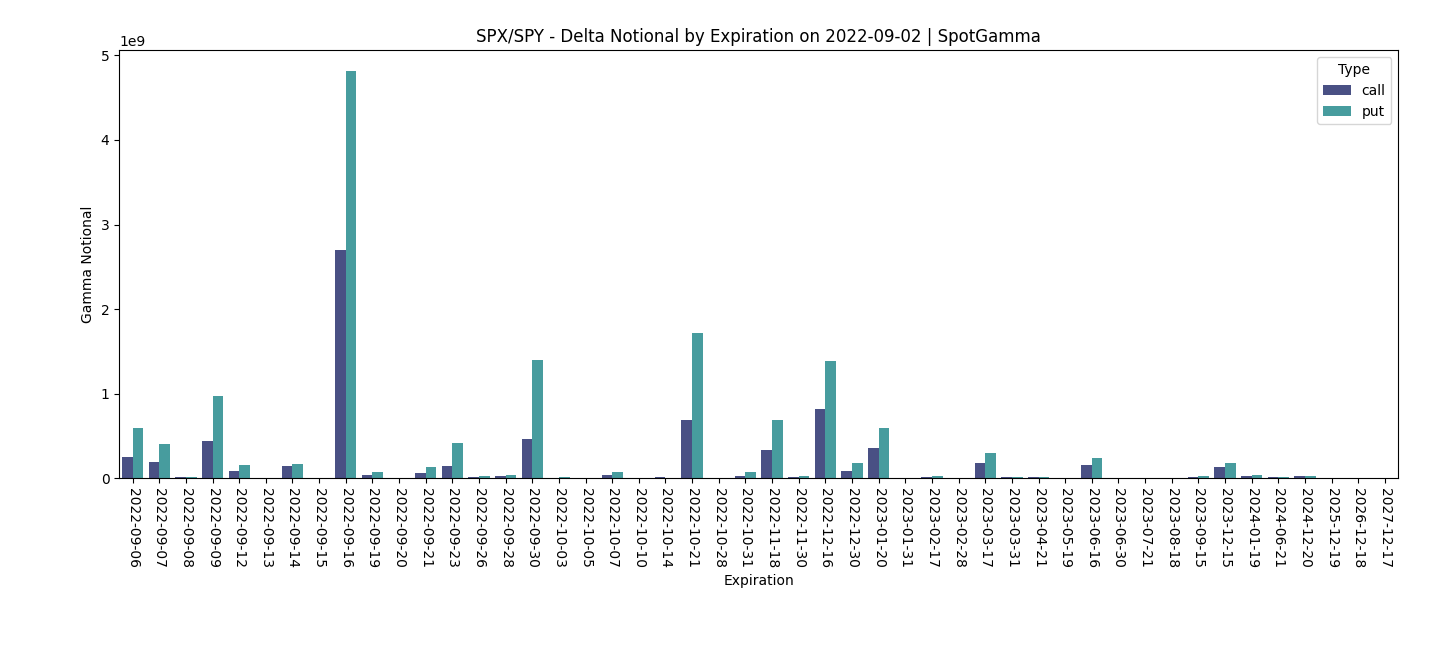

The issue here for bulls is that this major move is coming ahead of the key catalysts that we’ve been outlining (CPI 9/13, OPEX 9/16, FOMC 9/21). One bad CPI print or hawkish statement from the Fed very quickly unwinds this rally. Further, the market has extra sensitivity to gamma/IV because of the large OPEX next week – and that doesn’t resolve until 9/16. These keeps price action unstable in through Friday.
A good example of this comes from March wherein the setup was similar. There was a big rally in the week before a large OPEX, which quickly faded into OPEX week. Of course the market bottomed with the 3/16 FOMC + 3/18 OPEX which led to a ~10% rally as the catalysts cleared.

This is not to say that we have a view on the CPI or the Fed. They could be market positive events that continue a rally. We do have a view that this current price action is likely fueled by options which leads to over-extending price action. This can be exacerbated, for example, by selling very short dated pre-CPI options. We also believe that traders will want to hedge some risk into both of those macro data points – or at a minimum not be materially short volatility. In our view this prevents bulls from being “in the clear”.
Finally, as mentioned at the start, because all indicies/ETF’s are above their Call Walls we must label this move as overbought, and maintain that stance until/unless the Call Walls roll higher.
| SpotGamma Proprietary SPX Levels | Latest Data | SPX Previous | SPY | NDX | QQQ |
|---|---|---|---|---|---|
| Ref Price: | 4005 | 3996 | 400 | 12321 | 300 |
| SG Implied 1-Day Move:: | 0.99%, | (±pts): 40.0 | VIX 1 Day Impl. Move:1.48% | ||
| SG Implied 5-Day Move: | 2.92% | 3925 (Monday Ref Price) | Range: 3811.0 | 4040.0 | ||
| SpotGamma Gamma Index™: | -0.43 | -0.56 | -0.25 | -0.01 | -0.11 |
| Volatility Trigger™: | 4000 | 3950 | 400 | 12850 | 300 |
| SpotGamma Absolute Gamma Strike: | 4000 | 4000 | 400 | 12500 | 300 |
| Gamma Notional(MM): | -308.0 | (-400, 0) | -1394.0 | -1.0 | -811.0 |
| Put Wall: | 3900 | 3900 | 390 | 12000 | 290 |
| Call Wall : | 4005 | 4005 | 402 | 13250 | 299 |
| Additional Key Levels | Latest Data | Previous | SPY | NDX | QQQ |
|---|---|---|---|---|---|
| Zero Gamma Level: | 4044 | 4065 | 408.0 | 12384.0 | 312 |
| CP Gam Tilt: | 0.9 | 0.82 | 0.67 | 0.95 | 0.61 |
| Delta Neutral Px: | 4063 | ||||
| Net Delta(MM): | $1,831,626 | $1,787,426 | $203,788 | $48,861 | $104,802 |
| 25D Risk Reversal | -0.05 | -0.07 | -0.04 | -0.06 | -0.06 |
| Call Volume | 490,148 | 516,002 | 3,508,808 | 7,226 | 1,112,190 |
| Put Volume | 708,010 | 787,158 | 4,943,163 | 8,694 | 1,519,670 |
| Call Open Interest | 6,493,135 | 6,345,206 | 7,893,869 | 69,193 | 4,811,442 |
| Put Open Interest | 11,207,660 | 11,098,748 | 13,360,175 | 78,637 | 7,392,135 |
| Key Support & Resistance Strikes: |
|---|
| SPX: [4100, 4000, 3950, 3900] |
| SPY: [402, 400, 395, 390] |
| QQQ: [310, 300, 295, 290] |
| NDX:[13250, 13000, 12500, 12000] |
| SPX Combo (strike, %ile): [3898.0, 3950.0, 4006.0, 3998.0, 3902.0] |
| SPY Combo: [389.57, 394.77, 400.38, 399.58, 389.97] |
| NDX Combo: [12297.0, 12099.0, 12223.0, 12260.0] |


