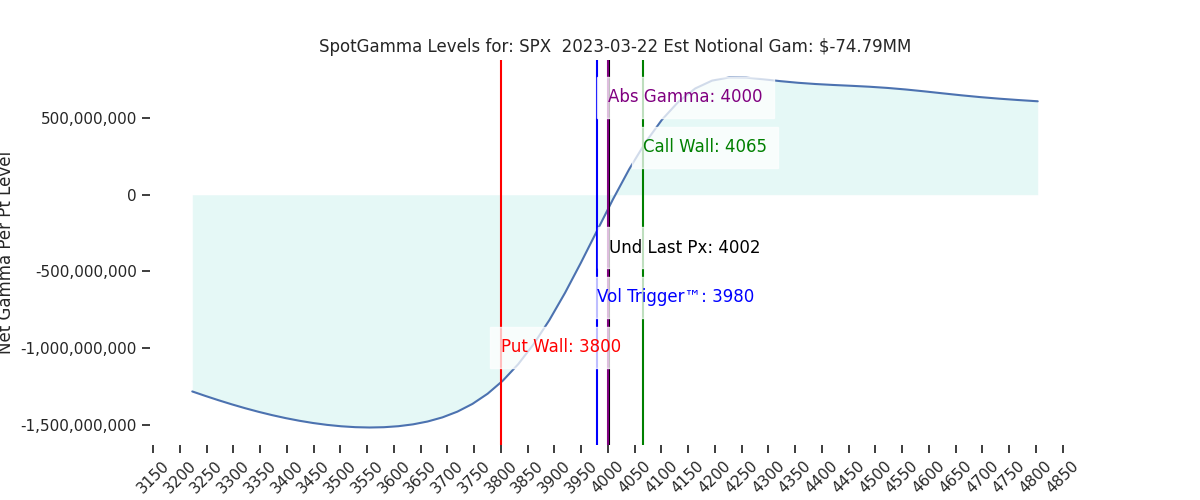
Futures are flat to last nights close, near 4030. Key SG levels are largely unchanged, with the 4065 Call Wall as major, long term resistance. 4000 – 4010 (SPY400) is now the strike range with the largest gamma, and a resistance/pivot line. Support shows at 3950, then 3900.
VIX expiration is at 9AM today, which should allow volatility to drift higher into the 2pm ET FOMC. Markets then turn to Powell, and traders assessment of Fed guidance will determine the short term path.
Clearly traders are looking for high volatility over todays session, with todays ATM straddle priced at $58 (ref: 4005, IV 55%). However, IV has decreased sharply since the banking crisis flared up two weeks ago, as shown in the SPX term structure below. This implies the policy response to the crisis has assuaged concerns – and Powell’s comments will be critical to keeping the peace.

While 4065 is our resistance/pin line into 3/31, we would also note its the zone directly overhead of that which as served as long term resistance.

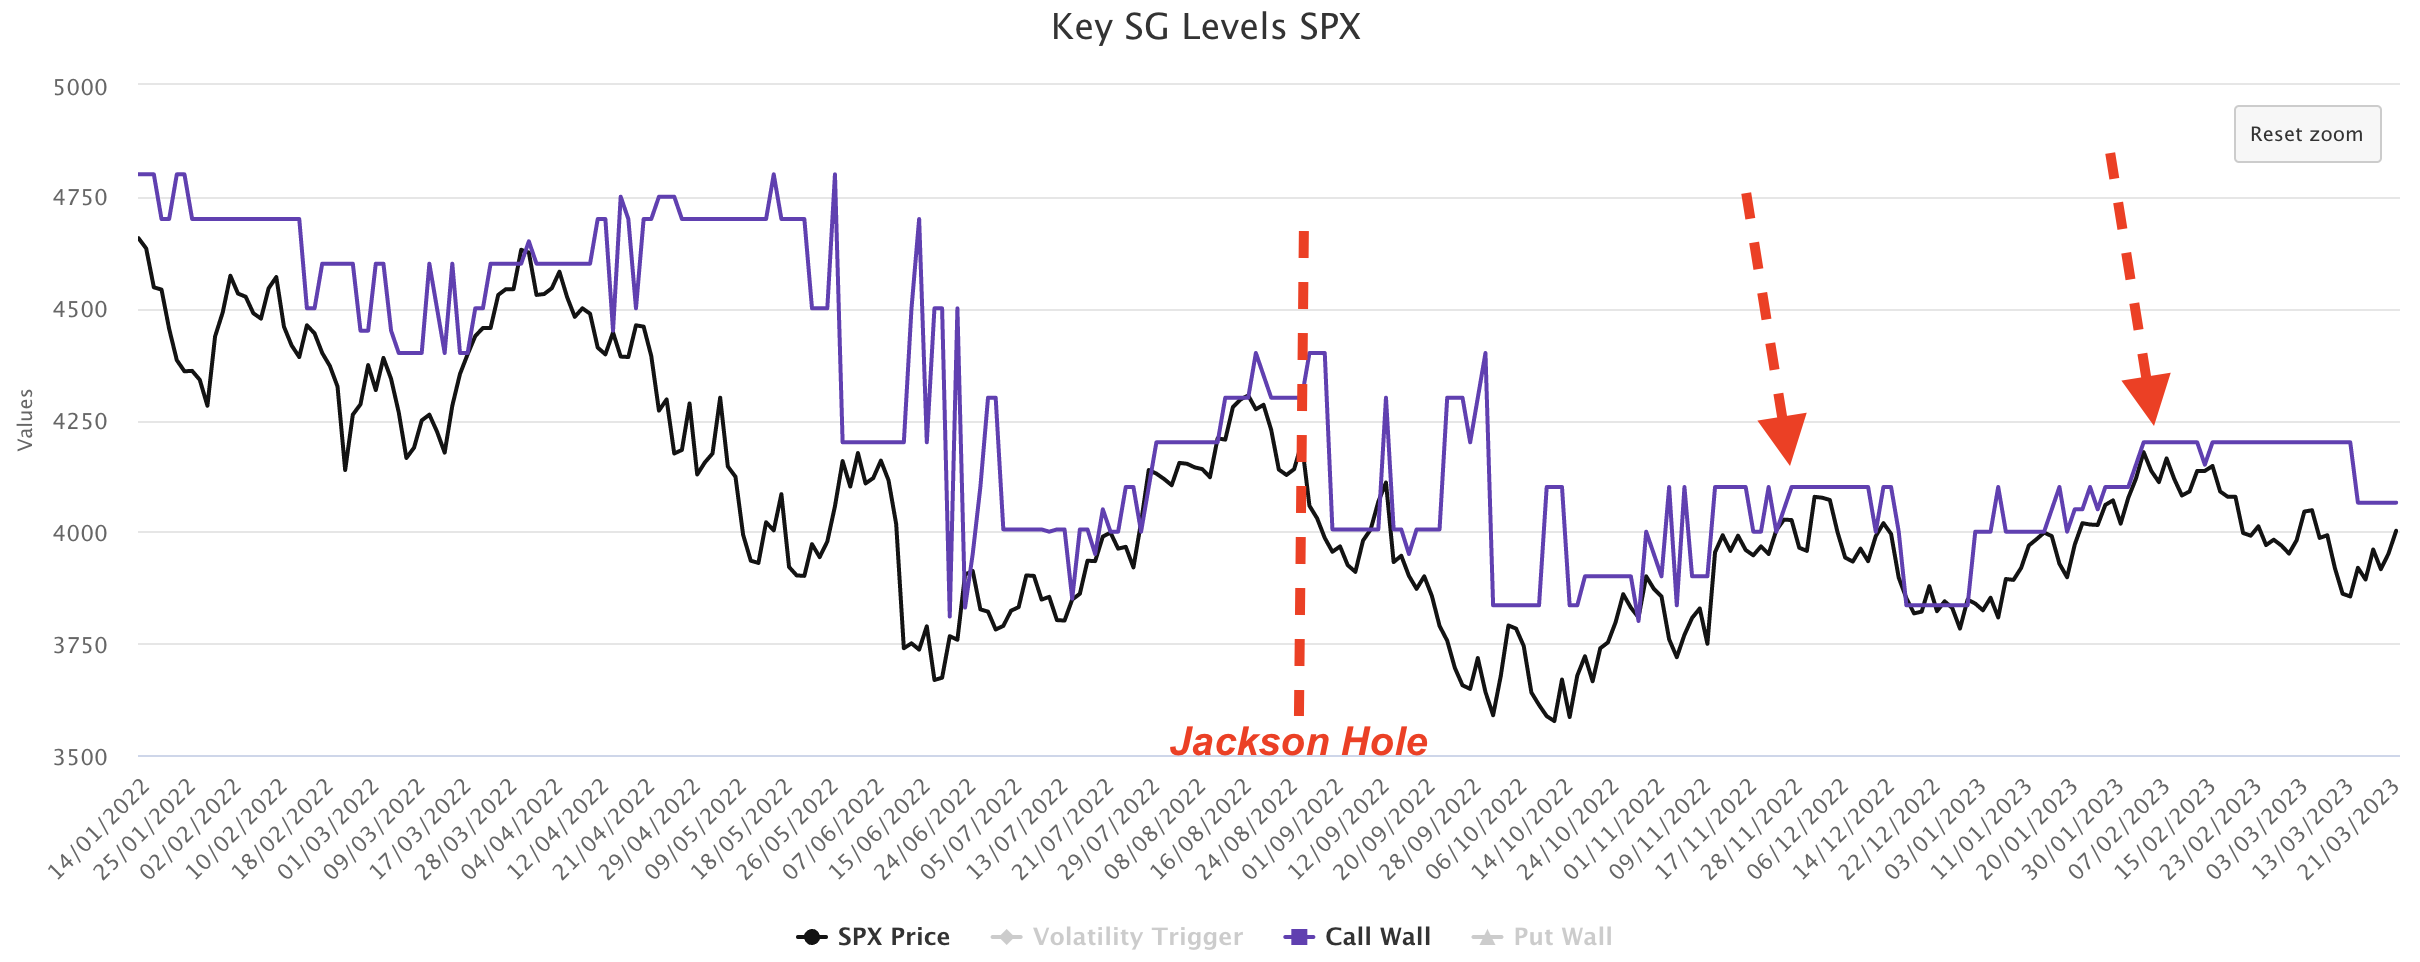
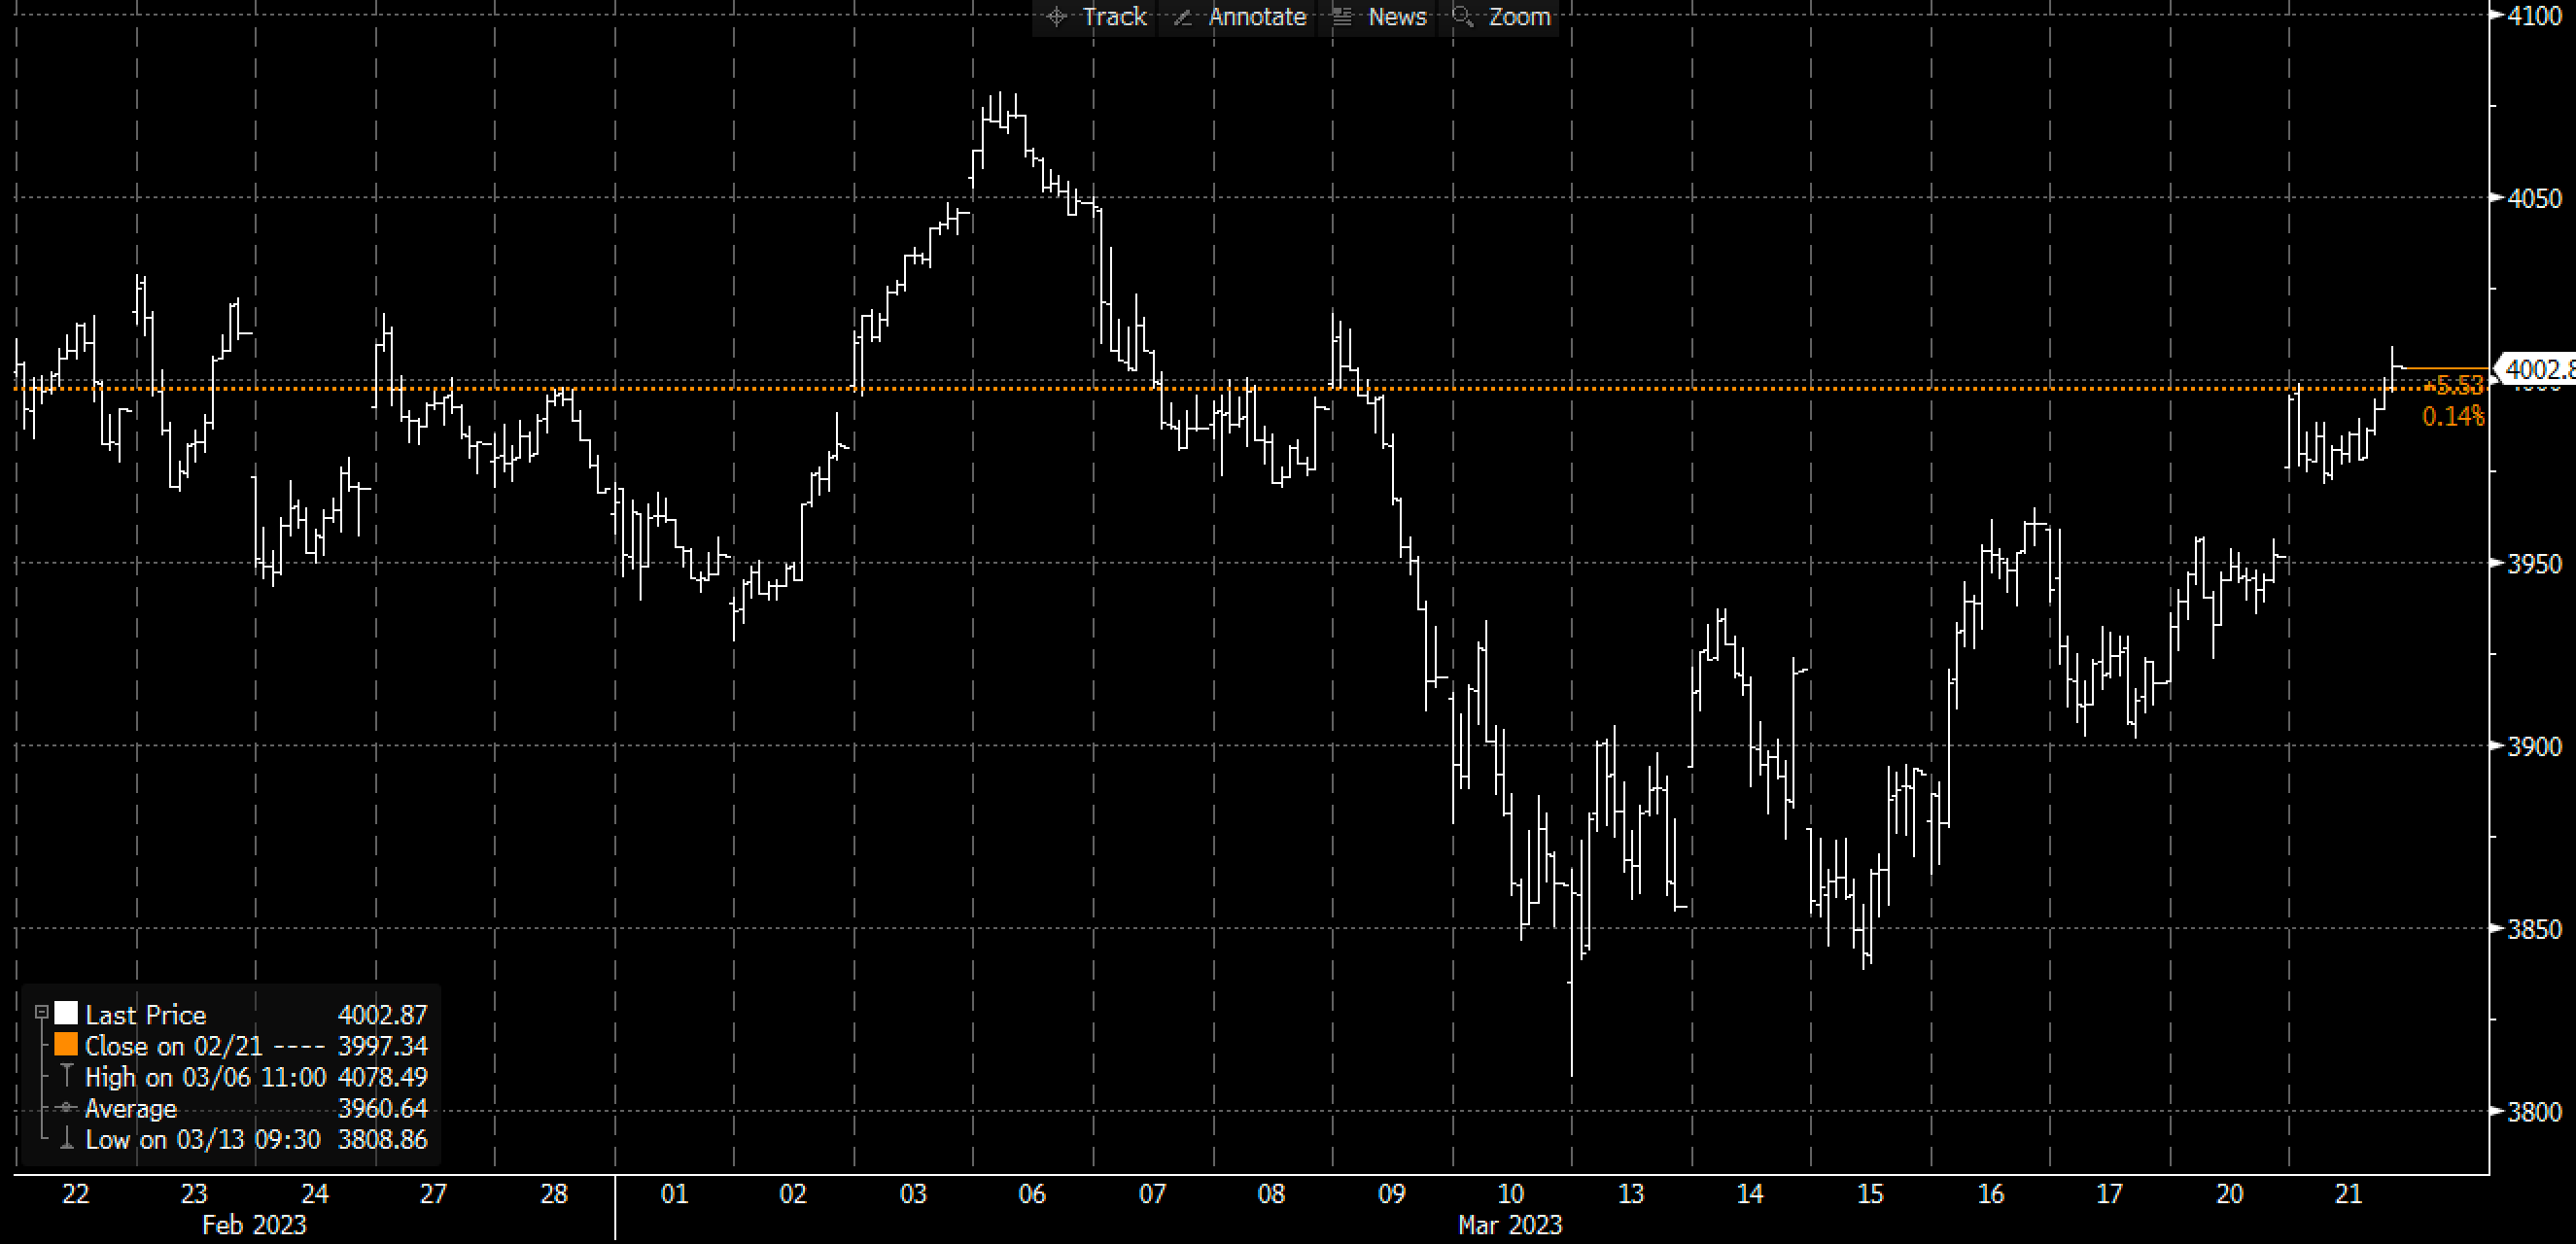
Whats interesting about this is that after Jackson Hole there seems to be a sharp decrease in call demand as the S&P tests this >4100 red zone. We state this based on Call Wall activity, which has persistently “stalled” as the S&P has tested the 4100-4100 zone.
Note in the plot below how the Call Wall stays at the same strike, despite the S&P500 testing that key resistance level (red arrows). The key insight here is that if traders felt the market would go higher, they would buy calls at increasingly higher strikes which would shift the Call Wall up. That didn’t happen despite markets testing the wall over multi-day periods.
Should the market rally post-FOMC, this Call Wall metric will be the critical measure we monitor to forecast increasingly higher prices.
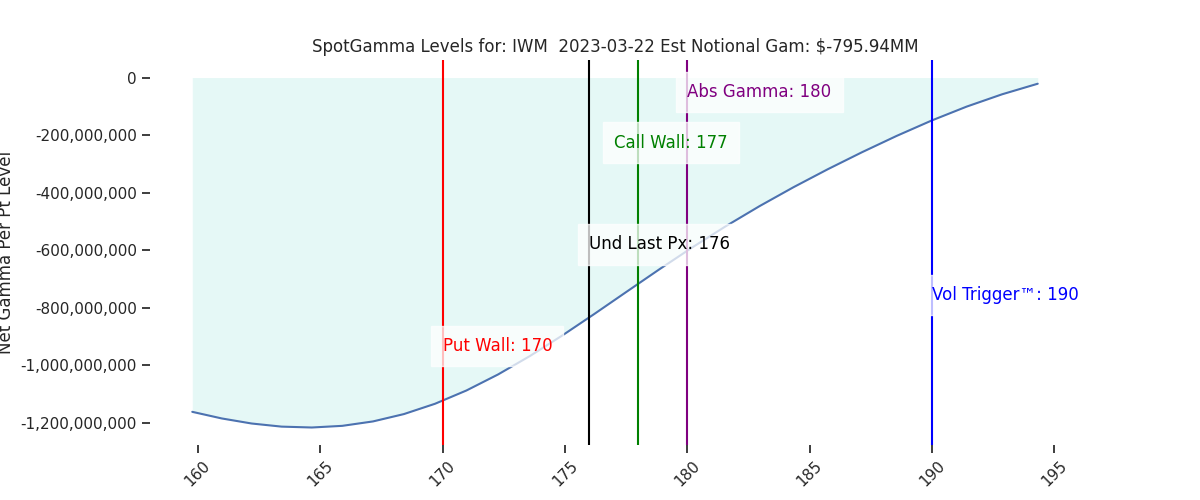
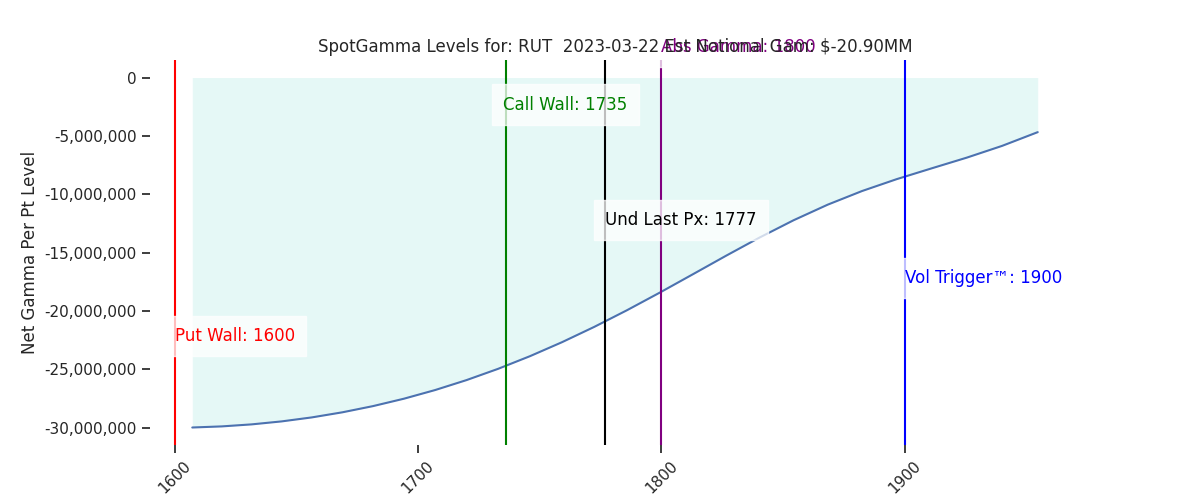
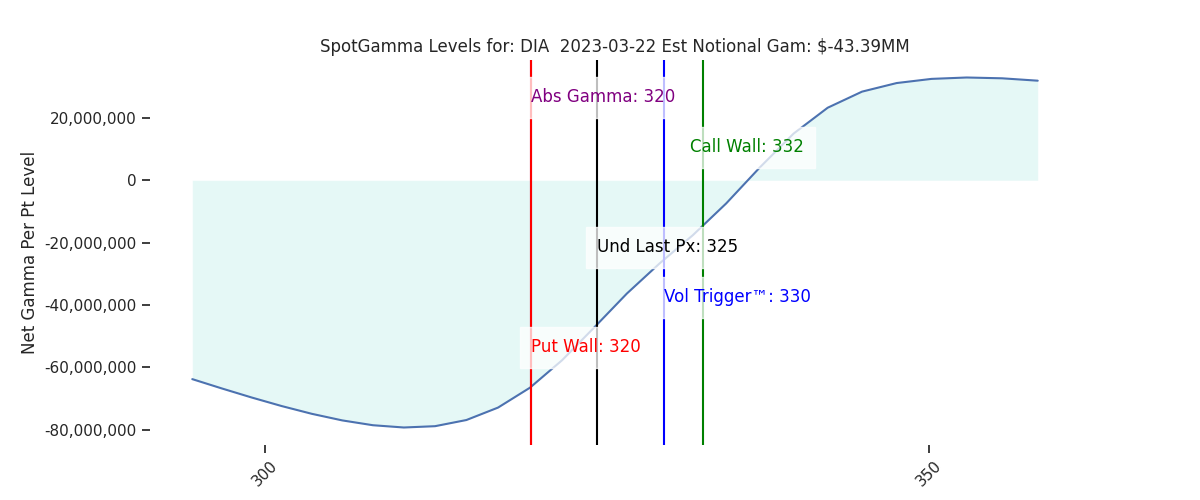
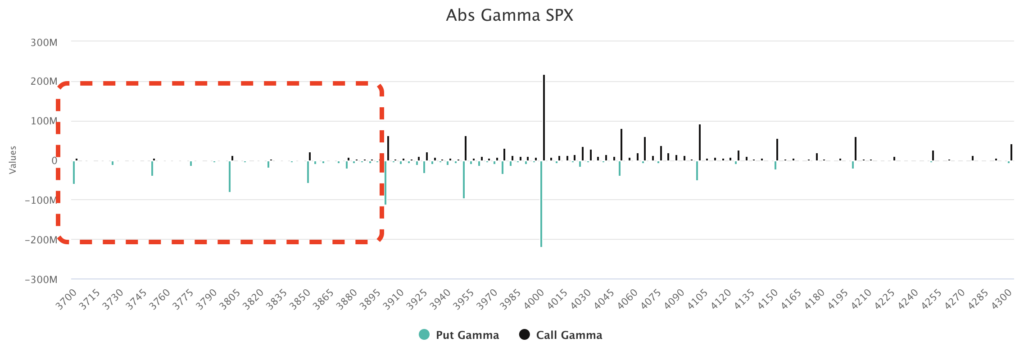
To the downside, if Powell upsets markets we feel that it will lead to a fairly quick test of the 3800 Put Wall. As shown below, it is <3900 where the gamma shifts to predominately put gamma (teal bars), and therefore we anticipate volatility increasing sharply.
However, unless there is a significant shift to the long term policy, that 3800 may hold as an interim low. We say this as into the teeth of the recent banking tail event, the S&P was unable to build downside put demand, and failed punch through this 3800 Put Wall. Should the Put Wall roll lower, we would be open to lower S&P prices.
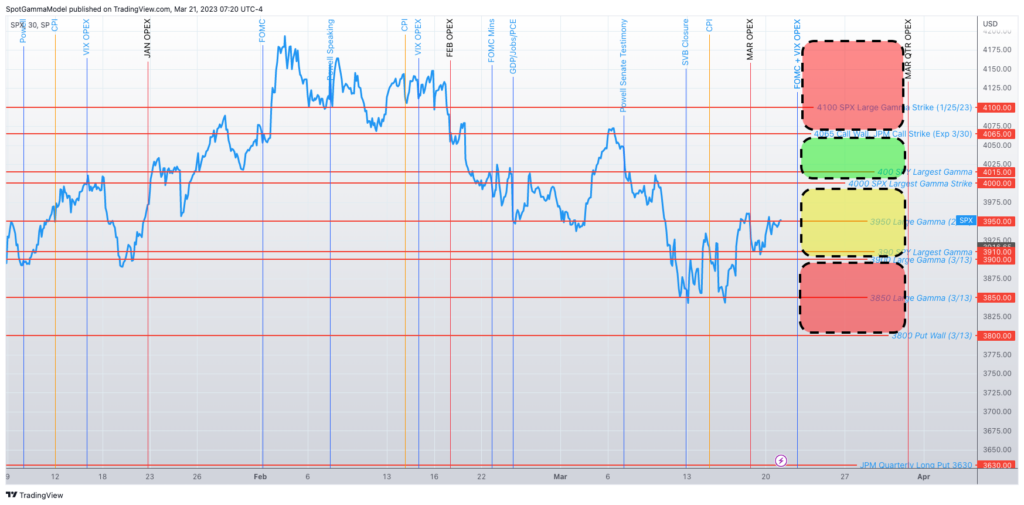
In summary, we point back to the price map we posted in yesterday’s AM note. We see the red areas as those wherein selling pressure increases, and green areas as bullish zones. 3900-4000 is neutral, as we see fairly balanced interest in that zone.
| SpotGamma Proprietary SPX Levels | Latest Data | SPX Previous | SPY | NDX | QQQ |
|---|---|---|---|---|---|
| Reference Price: | 4002 | 4005 | 398 | 12734 | 310 |
| SG Implied 1-Day Move: | 1.22%, | (±pts): 49.0 | VIX 1 Day Impl. Move:1.36% | ||
| SG Implied 5-Day Move: | 2.16% | 3916 (Monday Reference Price) | Range: 3832.0 | 4001.0 | ||
| SpotGamma Gamma Index™: | -0.00 | -0.61 | -0.20 | 0.02 | 0.02 |
| Volatility Trigger™: | 3980 | 3955 | 400 | 11975 | 304 |
| SpotGamma Absolute Gamma Strike: | 4000 | 4000 | 400 | 12525 | 300 |
| Gamma Notional (MM): | -75.0 | 83.0 | -1033.0 | 4.0 | 115.0 |
| Call Wall: | 4065 | 4065 | 402 | 12525 | 315 |
| Put Wall: | 3800 | 3800 | 390 | 11000 | 285 |
| Additional Key Levels | Latest Data | Previous | SPY | NDX | QQQ |
|---|---|---|---|---|---|
| Zero Gamma Level: | 4049 | 4022 | 407.0 | 11645.0 | 347 |
| Gamma Tilt: | 1.0 | 1.05 | 0.71 | 1.56 | 1.08 |
| Delta Neutral Px: | 3969 | ||||
| Net Delta (MM): | $1,251,309 | $1,217,056 | $174,441 | $42,569 | $97,623 |
| 25 Day Risk Reversal: | -0.04 | -0.06 | -0.04 | -0.04 | -0.05 |
| Call Volume: | 547,841 | 507,147 | 1,650,769 | 7,310 | 735,338 |
| Put Volume: | 989,021 | 929,982 | 2,600,934 | 6,757 | 932,933 |
| Call Open Interest: | 5,318,842 | 5,144,935 | 6,101,959 | 47,784 | 4,540,084 |
| Put Open Interest: | 10,079,538 | 9,909,172 | 12,718,503 | 51,014 | 7,871,124 |
| Key Support & Resistance Strikes: |
|---|
| SPX: [4100, 4000, 3950, 3900] |
| SPY: [400, 395, 390, 385] |
| QQQ: [315, 310, 305, 300] |
| NDX: [13000, 12525, 12000, 11000] |
| SPX Combo (Strike, Percentile): [(4199.0, 92.61), (4175.0, 76.63), (4151.0, 90.01), (4127.0, 75.2), (4099.0, 92.74), (4079.0, 78.46), (4075.0, 90.88), (4067.0, 95.02), (4059.0, 75.08), (4051.0, 92.59), (4035.0, 76.46), (4031.0, 84.35), (4027.0, 80.52), (3951.0, 90.17), (3915.0, 84.16), (3899.0, 94.81), (3851.0, 91.8), (3827.0, 75.13), (3815.0, 81.45)] |
| SPY Combo: [405.26, 388.51, 408.45, 418.43, 403.67] |
| NDX Combo: [12518.0, 12926.0, 13130.0, 12722.0, 13333.0] |