- Rallies should be categorized as “short covering” and subject to failure
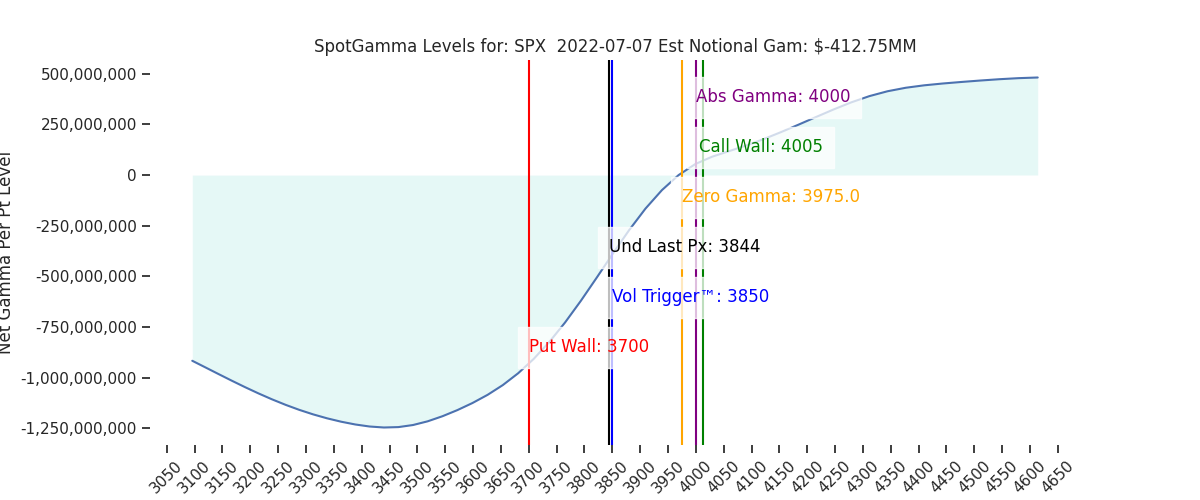
- Volatility should remain elevated until/unless the market closes >4000, the strike at which we see major resistance. 3700 is our major support line into 7/15
- July 15th & 20th are important dates to market due to large equity & VIX expirations
- July 27th is a key FOMC rate decision
Daily Note:
Futures are trading flat to last nights close of 3855. We anticipate further ~1% moves in equities today with support at 3800 then 3755 (SPY 375). Resistance is at 3850 & 3900.
SG models assign a bullish edge to equities while the S&P is >3800, and 4000 remains major resistance into month end. A break of 3800 likely brings a quick test of 3740.
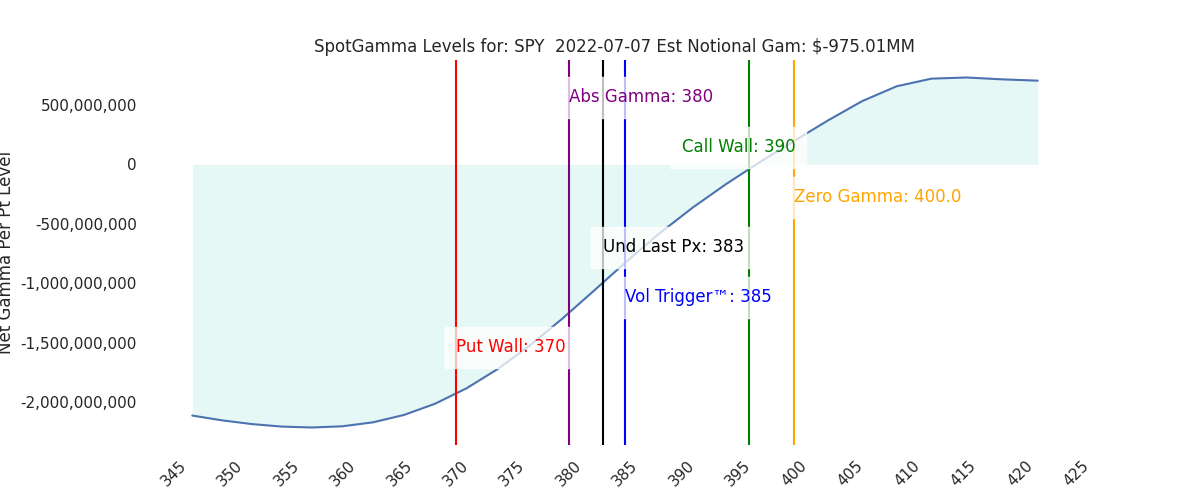
Not much is shifting in SG levels, but we are seeing positions fill in around the 380-390 area in SPY. This tends to make this range a bit stickier, as hedging flows are tied to this area. This should in turn reduce vol and, by default, be a small tailwind for equities. The bigger market catalysts arrive toward the middle to end of July which is why we view this current market as more about “drift” than “drive”. (“Drive” generally comes with expirations as options flows become more dominant).

In regards to equity downside, we continue to closely monitor skew in its various forms for signs of life. Below is the VVIX(brown) and TDEX(blue), which are near pre-Covid lows. Both are a measure of OTM options demand (TDEX= equity, VVIX = VIX), and their decline suggests options traders are not positioning for major downside in equities.
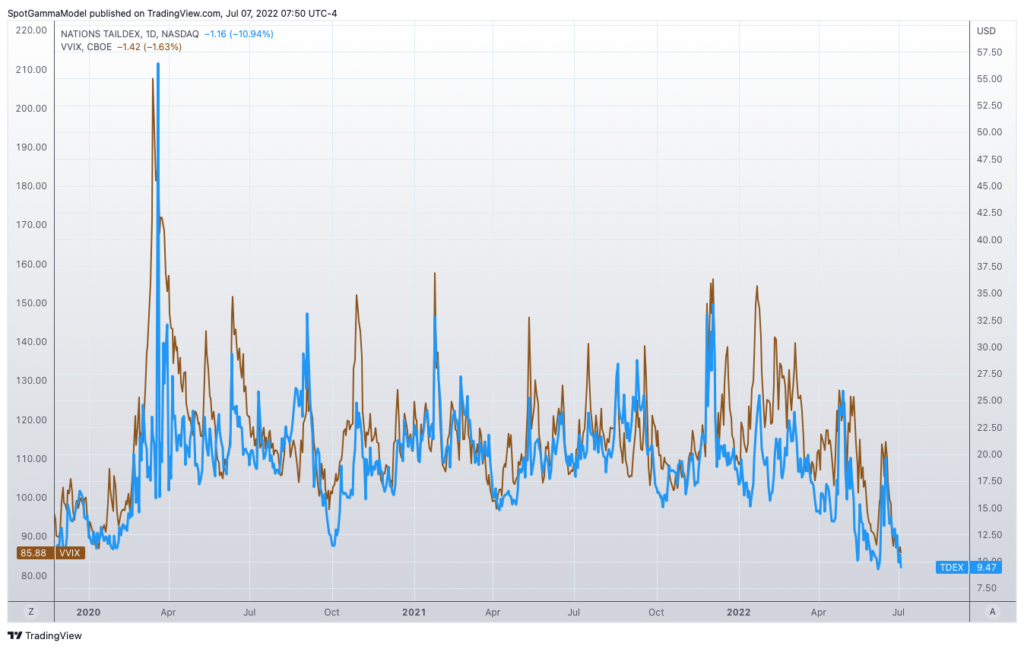
There has been a lot of discussion around the fact that tail risk has not paid off as vol has remained somewhat contained – despite large equity drawdowns this year. This reads as traders are therefore expecting more of the same (contained vol) – and we do wonder if it could catch some offsides if we get a surprise stock move lower.
For now its likely that traders want to hold a bit more of a long vol position into FOMC (7/27), but before then we’d be looking for shorter dated vol sellers to appear on any drawdowns (aka more of these depressed/flat skew readings).
| SpotGamma Proprietary SPX Levels | Latest Data | SPX Previous | SPY | NDX | QQQ |
|---|---|---|---|---|---|
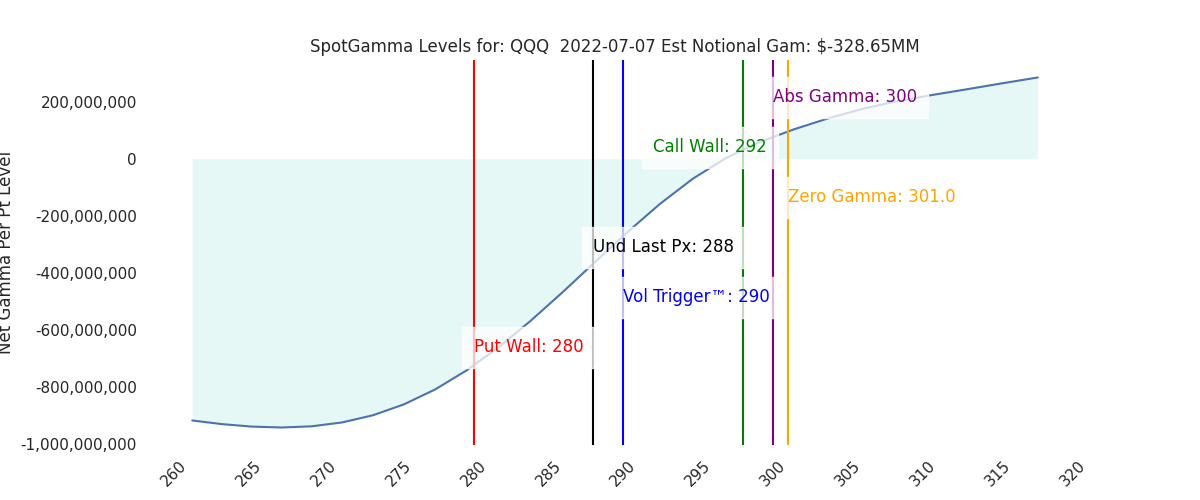
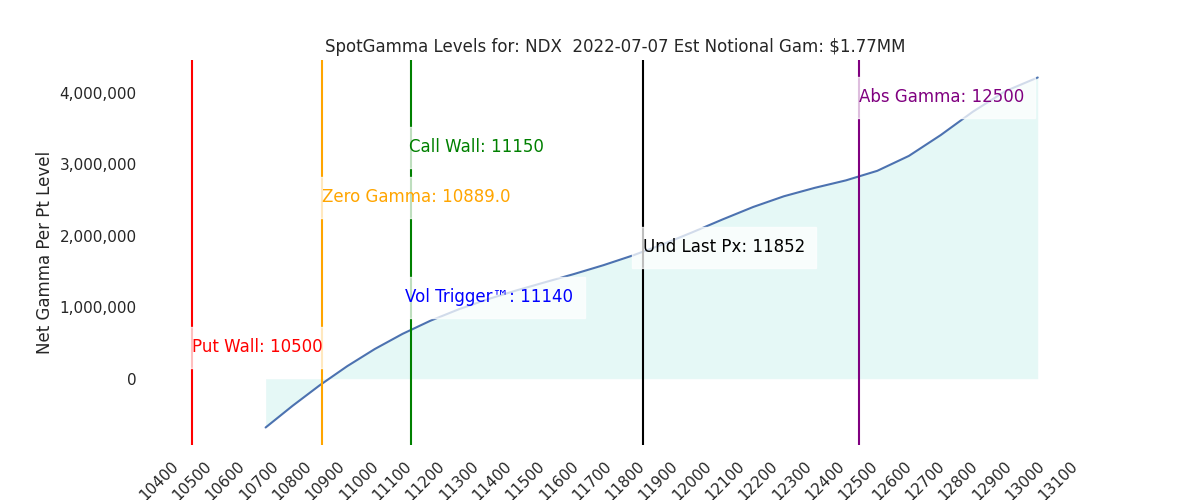
| Ref Price: | 3844 | 3844 | 383 | 11852 | 288 |
| SpotGamma Imp. 1 Day Move: Est 1 StdDev Open to Close Range |
1.27%, | (±pts): 49.0 | VIX 1 Day Impl. Move:1.69% | ||
| SpotGamma Imp. 5 Day Move: | 2.71% | 3825 (Monday Ref Px) | Range: 3721.0 | 3929.0 | ||
| SpotGamma Gamma Index™: | -0.71 | -0.67 | -0.17 | 0.01 | -0.05 |
| Volatility Trigger™: | 3850 | 3800 | 385 | 11140 | 290 |
| SpotGamma Absolute Gamma Strike: | 4000 | 4000 | 380 | 12500 | 300 |
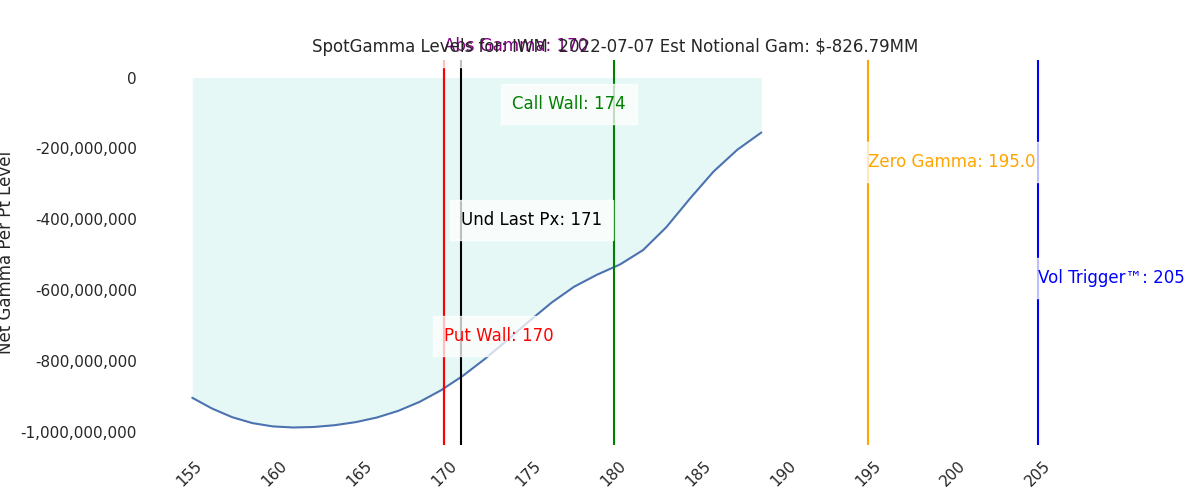
| Gamma Notional(MM): | -413.0 | -407.61 | -975.0 | 2.0 | -329.0 |
| Additional Key Levels | Latest Data | Previous | SPY | NDX | QQQ |
|---|---|---|---|---|---|
| Zero Gamma Level: | 3975 | 3944 | 0 | 0 | 0 |
| Put Wall Support: | 3700 | 3700 | 370 | 10500 | 280 |
| Call Wall Strike: | 4005 | 4005 | 390 | 11150 | 292 |
| CP Gam Tilt: | 0.77 | 0.75 | 0.62 | 1.17 | 0.77 |
| Delta Neutral Px: | 4049 | ||||
| Net Delta(MM): | $1,524,058 | $1,498,247 | $148,486 | $47,907 | $94,038 |
| 25D Risk Reversal | -0.07 | -0.08 | -0.06 | -0.07 | -0.07 |
| Call Volume | 344,424 | 468,992 | 1,628,838 | 6,097 | 756,355 |
| Put Volume | 657,679 | 776,862 | 1,924,633 | 5,125 | 911,436 |
| Call Open Interest | 5,626,975 | 5,522,560 | 6,539,736 | 62,458 | 4,286,258 |
| Put Open Interest | 9,542,380 | 9,472,540 | 10,118,682 | 51,187 | 6,158,407 |
| Key Support & Resistance Strikes: |
|---|
| SPX: [4000, 3900, 3850, 3800] |
| SPY: [390, 380, 375, 370] |
| QQQ: [300, 290, 285, 280] |
| NDX:[12500, 12000, 11250, 11150] |
| SPX Combo (strike, %ile): [3798.0, 3749.0, 3714.0] |
| SPY Combo: [378.57, 373.62, 370.18] |
| NDX Combo: [11493.0, 11296.0] |