Macro Theme:
Major Resistance: $4,300
Pivot Level: $4,200
Interim Support: $4,250
Range High: $4,300 Call Wall
Range Low: $4,000 Put Wall
‣ We are neutral on the S&P while it remains >$4,200
‣ S&P500 may close its performance gap to Nasdaq based on IV and call positions
‣ June FOMC 6/14
‣ June OPEX 6/16
Founder’s Note:
Futures are flat to 4,275 with SG levels unchanged. 4,300 remains overhead resistance, with first support at 427 SPY (4,280 SPX) and more material support at 4,250. We continue to anticipate low volatility in the S&P.
In QQQ we have the largest gamma bar at 350, along with the Vol Trigger at 349 – both of which indicate short term support.
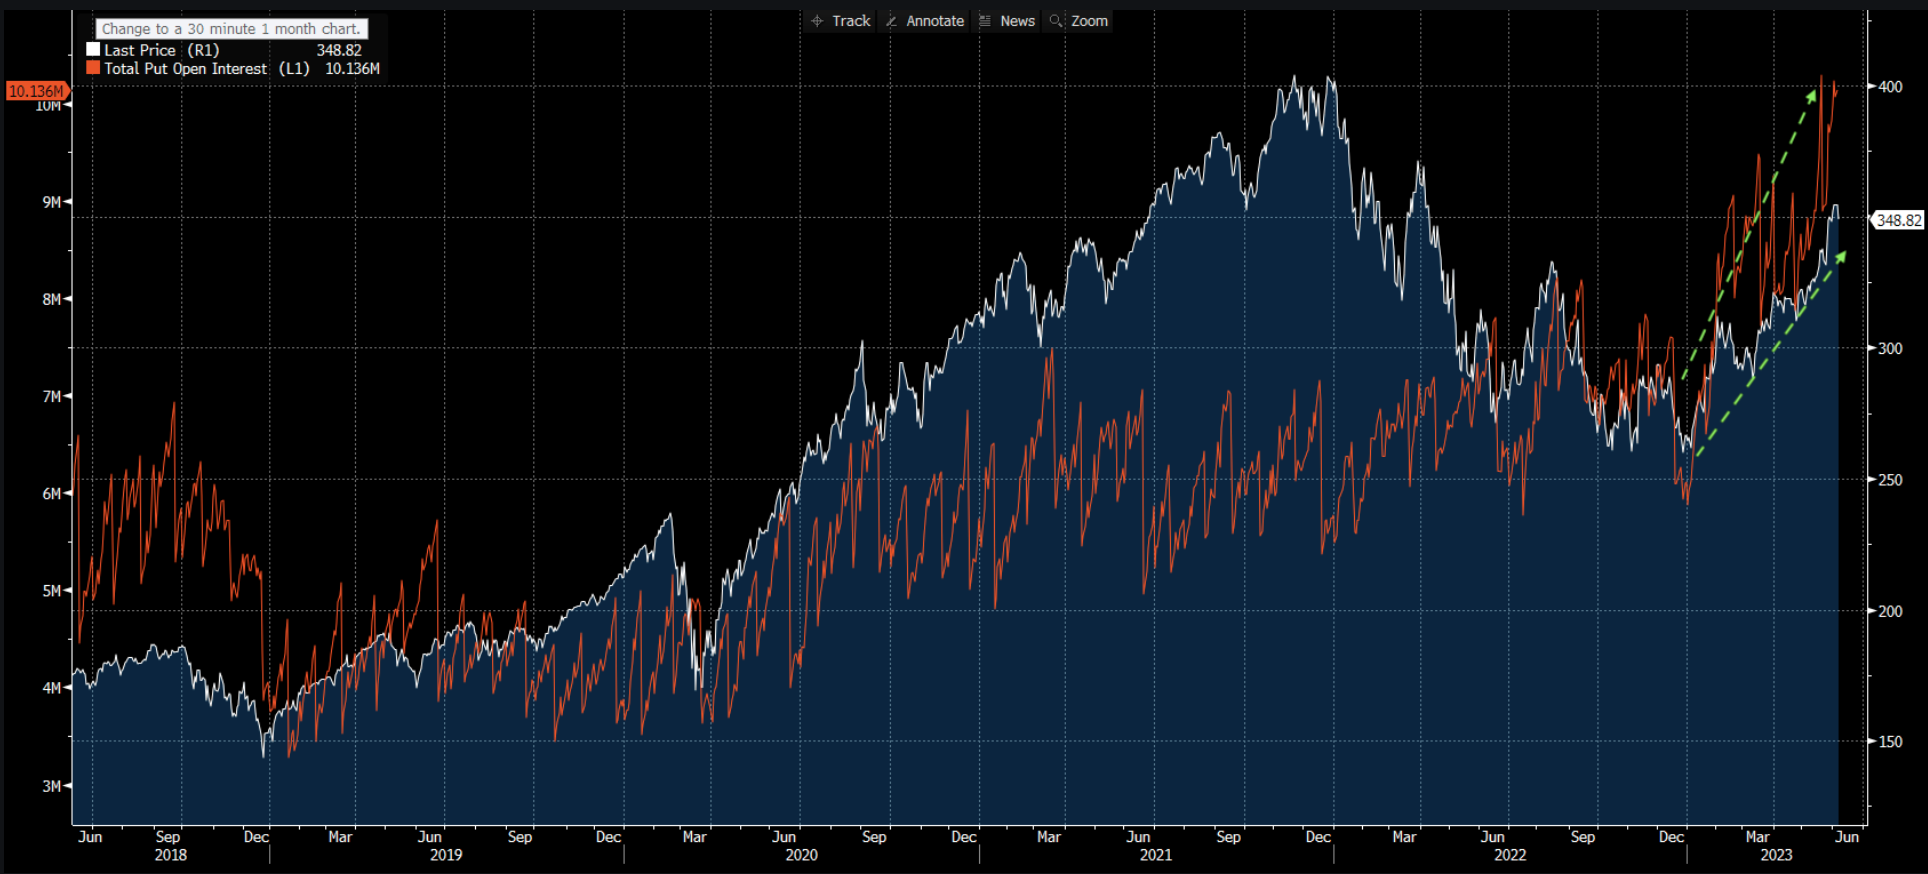
The story, of course, remains the divergence between IWM & QQQ. In yesterdays AM note we discussed Tuesday’s record IWM call activity, and Goldman is now highlighting record QQQ put open interest as “panic for downside hedges” (h/t ZH).
There is indeed record QQQ put interest, however you can see that put interest has grown in lockstep with QQQ’s price throughout ’23. There is not record QQQ call interest, but yesterday was the 7th largest QQQ call volume day ever (11th largest put volume day, 7th largest total volume). Additionally we think the lack of record call interest makes sense through the lens of re-grossing & traders likely owning the underlying vs calls.
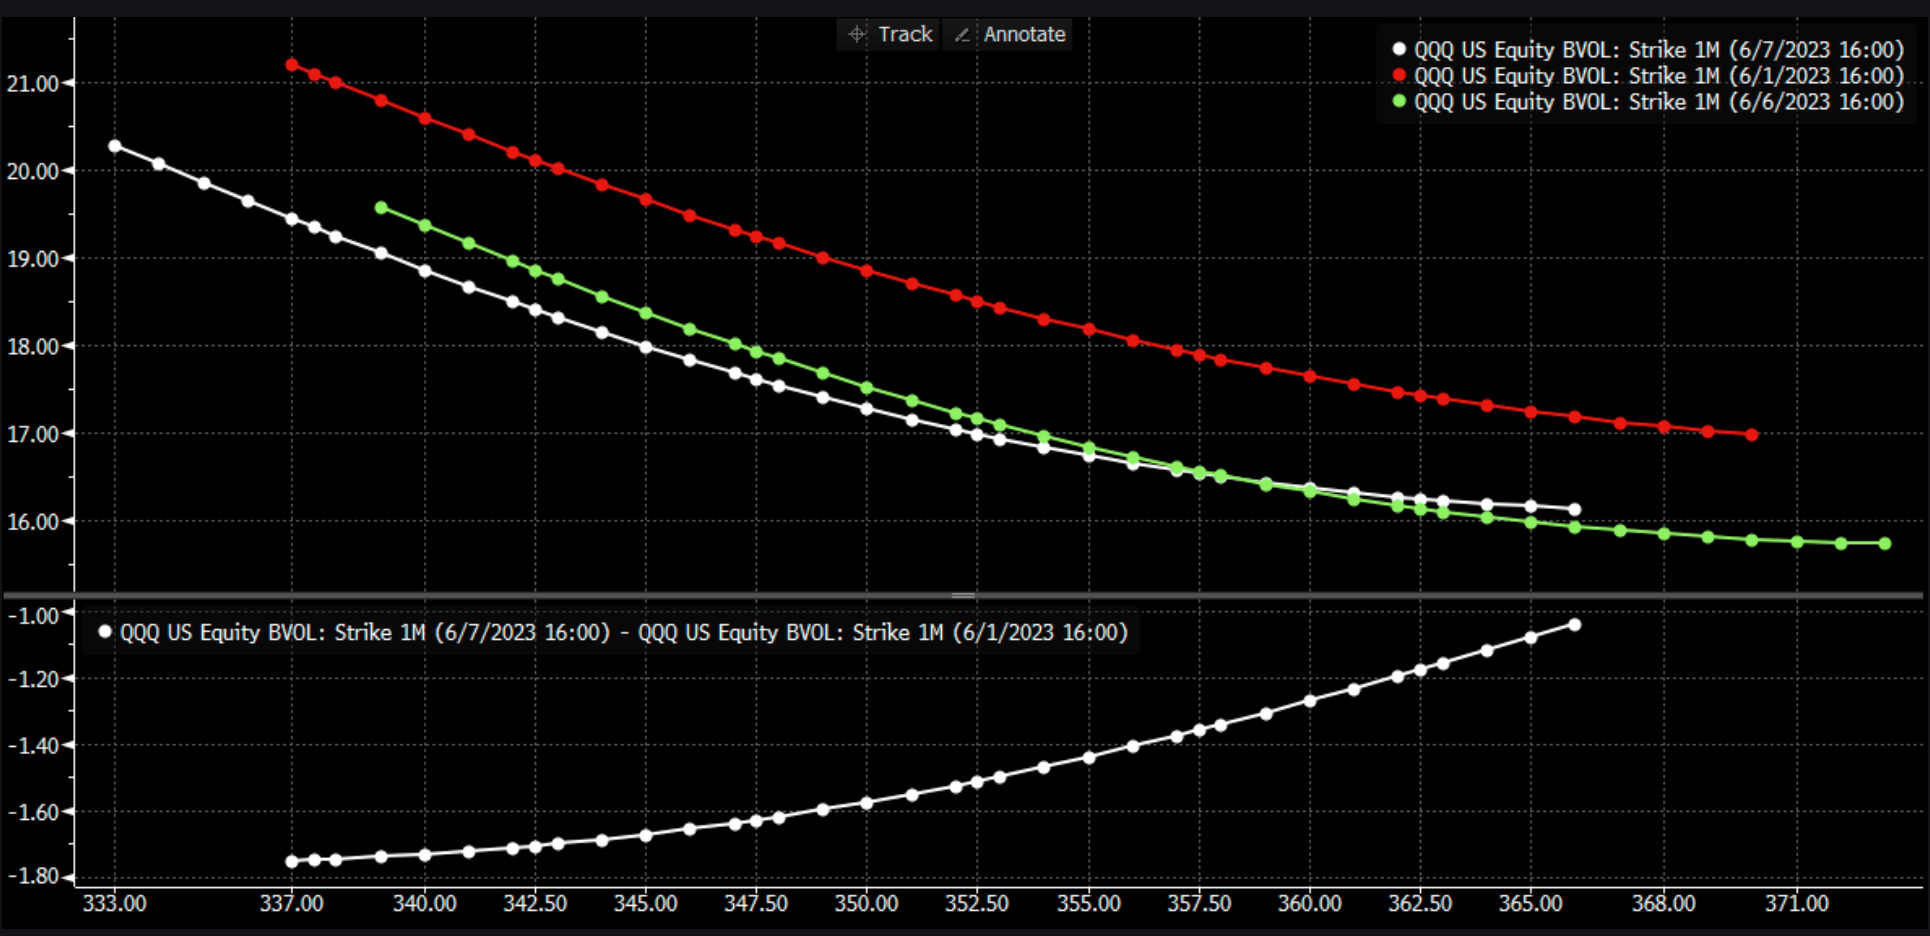
No matter how you cut it, implied volatility has been trending lower. Below is fixed strike volatility, wherein we compare IV 1 week ago (red) vs yesterday (white) and 2 days ago (green). This implies that any increase in at-the-money QQQ IV is simply due to the Q’s sliding 1.7% lower (more on this concept here).
That is a big move, but you have to put that in the context of IWM +1.59% and SPY -40bps. We’d also pause here to note yesterday was IWM’s second largest call volume day ever (1.015 million contracts vs Tuesday’s 1.03mm).
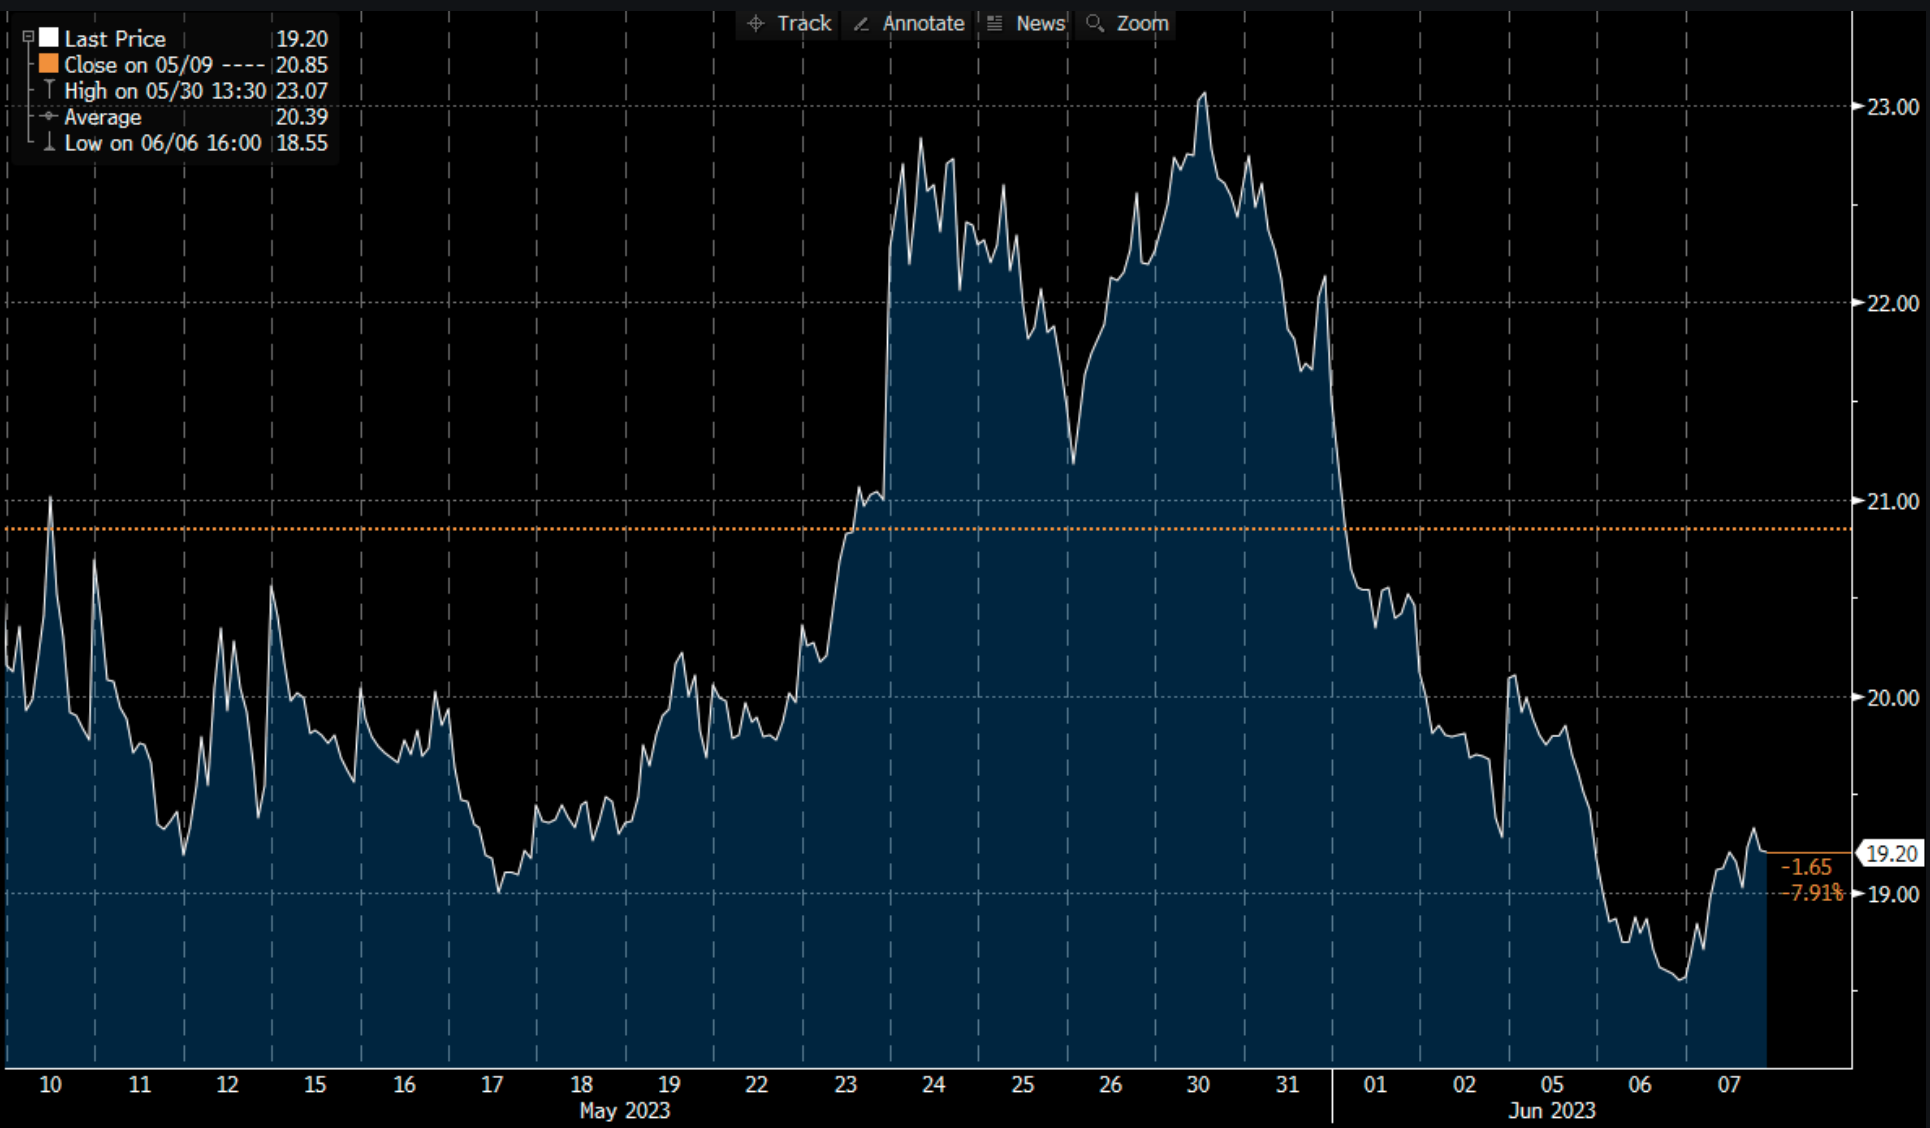
Back to QQQ, we have the Nasdaq VIX (VXN) shown below. If there was indeed a panic for downside hedges one would expect a bid in implied vols – and the VXN did little.
Its hard to see this market action as anything but “rotation” out of QQQ and into IWM – albeit a violent one. When panics occur, and volatility spikes, correlation moves to one. This means all equities move down in tandem. That’s not happening…at least yet.
It is concerning to see an increasing pace of record volumes & open interest, as we believe that options imply leverage. Higher leverage is a recipe for volatility.
Due to 6/16’s massive options expiration, we have been looking for the S&P to pin its high gamma area of 4,250-4,300, and thus far the market is cooperating. However, the combination of 6/14 FOMC & 6/16 OPEX are major catalysts for volatility, but these dates obviously remain a week out.
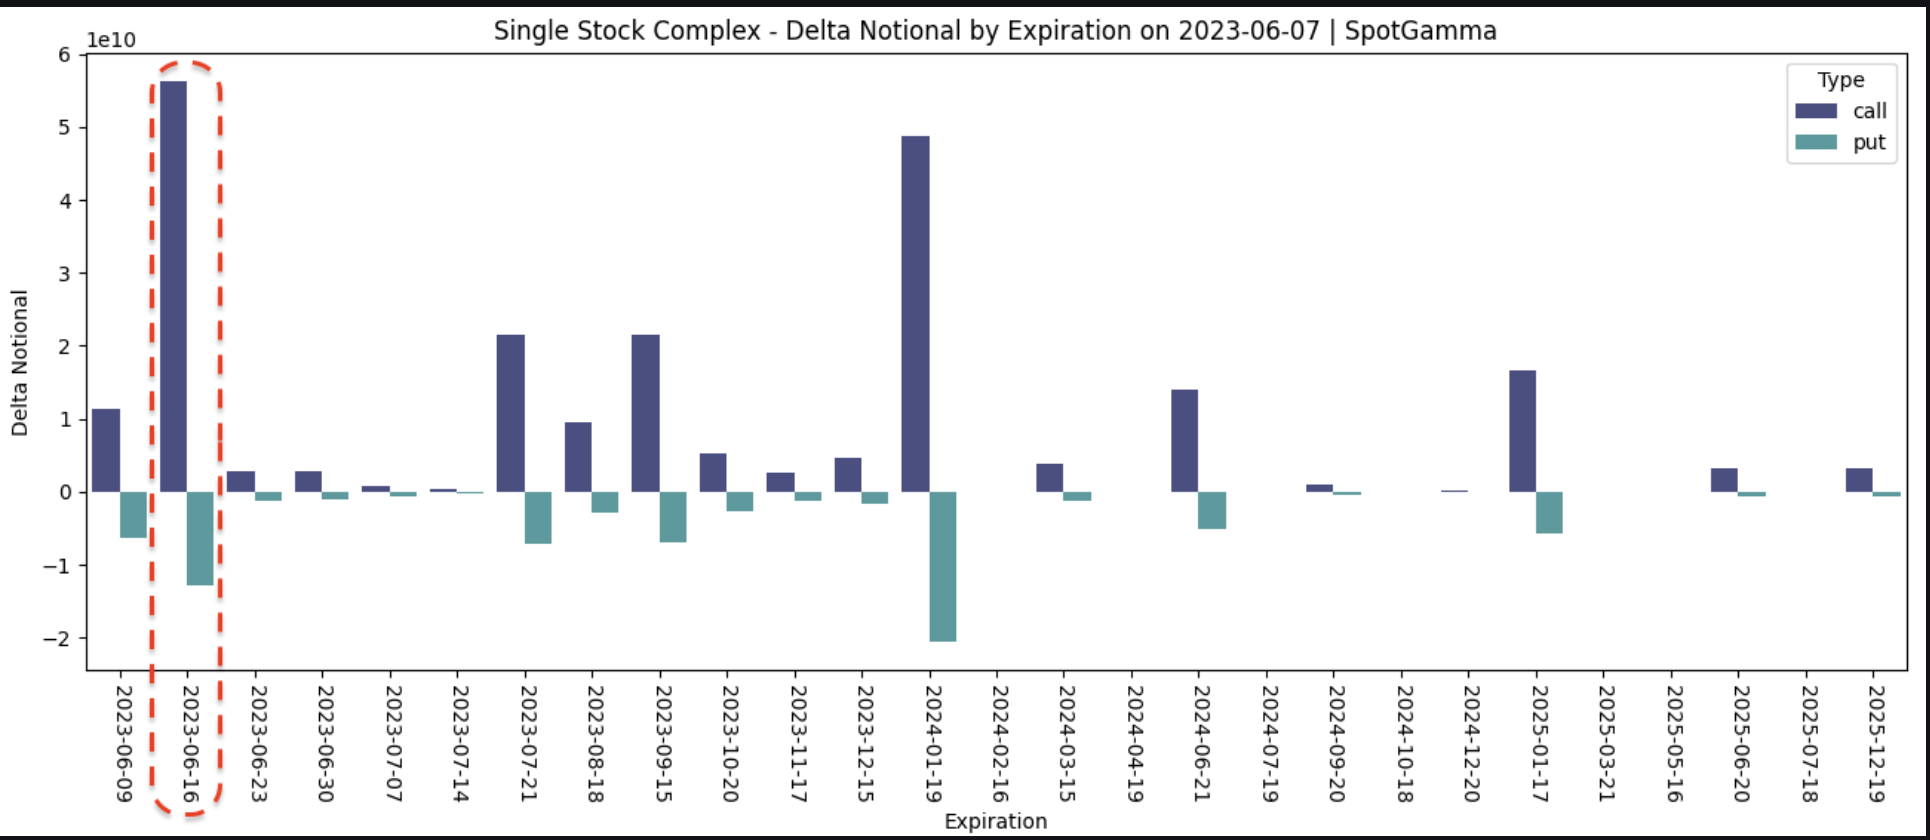
We also believe that call heavy expirations, which June indeed is, lead to downside consolidation in equities (vs put-heavy exp’s leading to rallies). Shown below is single stock call delta (blue) and put delta (teal) by expiration, and the thesis is that these deep in the money calls carry long stock hedges that must be unwound at OPEX (we’re preparing some stats around this for next week).
Therefore the balance here is that traders do not have an incentive to carry long volatility positions over what should be a quiet pre-FOMC period (4 likely sleepy trading days + weekend), which should continue to support equities.
In the past we’ve been guilty of being “too cute” with trying to time the entry of long volatility positions around expirations and/or options related triggers. With this in mind one could also argue that, if you wanted to enter some downside hedges to play a possible >6/14 window of weakness, the volatility carry of longer dated puts shouldn’t be too expensive. This is because post-FOMC IV is likely to hold up due to the FOMC event volatility.
| SpotGamma Proprietary Levels | SPX | SPY | NDX | QQQ | RUT | IWM |
|---|---|---|---|---|---|---|
| Reference Price: | $4267 | $426 | $14304 | $348 | $1888 | $187 |
| SpotGamma Implied 1-Day Move: | 0.82% | 0.82% |
|
|
|
|
| SpotGamma Implied 5-Day Move: | 2.16% |
|
|
|
|
|
| SpotGamma Volatility Trigger™: | $4245 | $427 | $13425 | $349 | $1770 | $181 |
| Absolute Gamma Strike: | $4300 | $425 | $13850 | $350 | $1800 | $185 |
| SpotGamma Call Wall: | $4300 | $430 | $13850 | $360 | $1790 | $190 |
| SpotGamma Put Wall: | $4000 | $425 | $14190 | $332 | $1750 | $170 |
| Additional Key Levels | SPX | SPY | NDX | QQQ | RUT | IWM |
|---|---|---|---|---|---|---|
| Zero Gamma Level: | $4211 | $426 | $12938 | $351 | $1869 | $185 |
| Gamma Tilt: | 1.42 | 0.959 | 2.087 | 0.884 | 1.058 | 1.05 |
| SpotGamma Gamma Index™: | 2.077 | -0.046 | 0.087 | -0.045 | 0.004 | 0.007 |
| Gamma Notional (MM): | $824.499M | ‑$36.552M | $11.995M | ‑$228.904M | $2.669M | $83.57M |
| 25 Day Risk Reversal: | -0.036 | -0.04 | -0.032 | -0.035 | -0.014 | -0.003 |
| Call Volume: | 553.041K | 2.111M | 11.208K | 946.146K | 67.046K | 908.915K |
| Put Volume: | 882.467K | 2.643M | 14.312K | 1.592M | 122.725K | 942.75K |
| Call Open Interest: | 6.706M | 7.562M | 76.097K | 5.136M | 220.528K | 4.009M |
| Put Open Interest: | 12.956M | 14.488M | 71.485K | 10.33M | 388.021K | 8.183M |
| Key Support & Resistance Strikes |
|---|
| SPX Levels: [4300, 4250, 4200, 4150] |
| SPY Levels: [428, 427, 425, 420] |
| NDX Levels: [15125, 15000, 14000, 13850] |
| QQQ Levels: [355, 350, 345, 340] |
| SPX Combos: [(4477,77.16), (4451,93.48), (4425,80.94), (4404,77.54), (4400,99.31), (4391,74.29), (4374,95.50), (4370,83.47), (4366,81.95), (4361,88.12), (4353,86.12), (4349,99.17), (4344,75.87), (4340,88.79), (4336,77.83), (4332,92.87), (4323,99.06), (4319,99.31), (4314,87.12), (4310,94.93), (4306,77.08), (4302,99.96), (4293,89.20), (4289,90.27), (4285,82.11), (4280,95.15), (4276,95.00), (4263,84.36), (4250,88.77), (4246,80.92), (4242,87.23), (4204,80.20), (4191,75.10), (4148,75.99), (4101,90.91)] |
| SPY Combos: [428.3, 438.11, 432.99, 430] |
| NDX Combos: [13847, 14763, 13618, 14562] |
| QQQ Combos: [354.13, 361.8, 362.5, 331.8] |
0 comentarios