Macro Theme:
Major Resistance: $4,450
Pivot Level: $4,400
Interim Support: $4,400
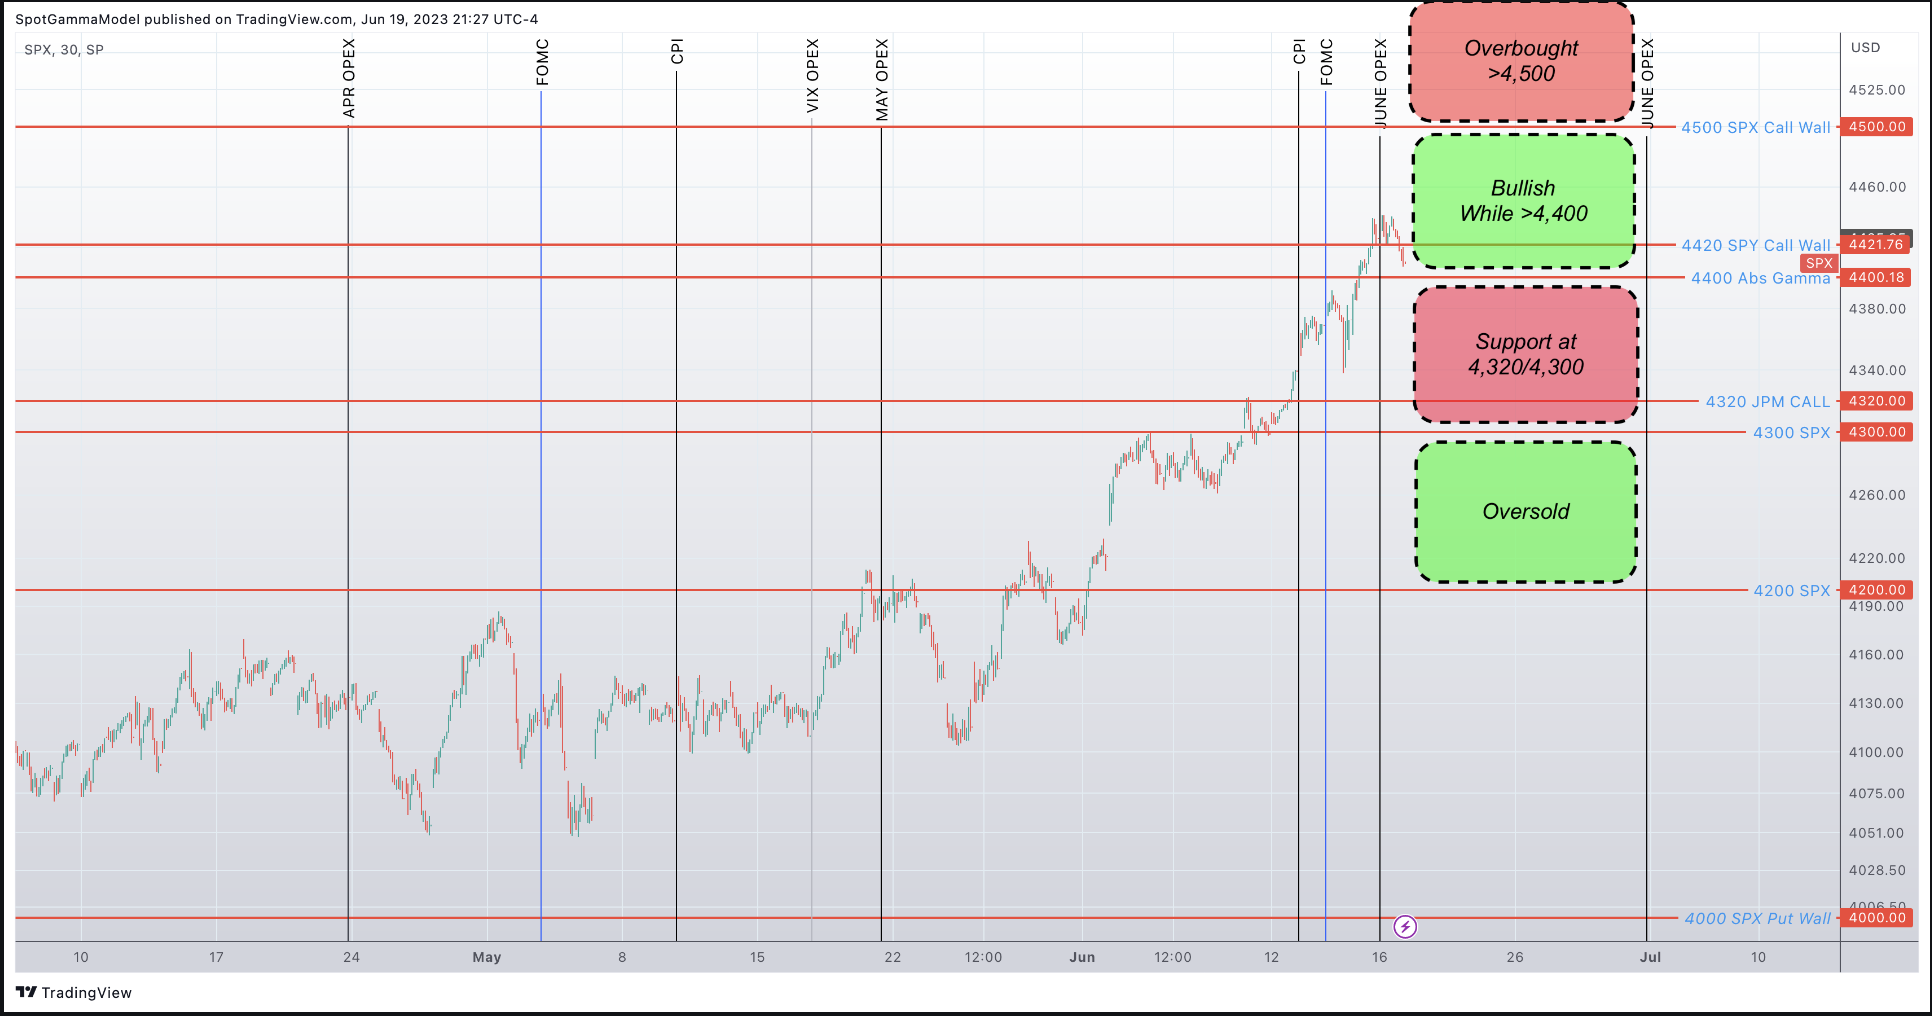
Range High: $4,500 Call Wall
Range Low: $4,000 Put Wall
‣ We are neutral on the S&P, and looking for a window of weakness post 6/14 FOMC & 6/16 OPEX
‣ Much of our data into 6/16 suggests that call buying is at major extremes, backing our views for a market correction
Founder’s Note:
Futures have shifted -33bps to 4439. With Friday’s large expiration we see a shift in SG levels: 4,420 (SPY 442 Call Wall) & 4,450 are major overhead resistance points. 4,400 is first support, with 4,374 & 4,350 key levels below there.
The SPX Call Wall has rolled higher to 4500, while the SPY & QQQ Call Walls retracted to 442 & 370, respectively.
We continue to anticipate a round of market consolidation this week, with 4,400 being the largest gamma strike on the board. We hold a bullish stance while the S&P is above this level, and are bearish below.
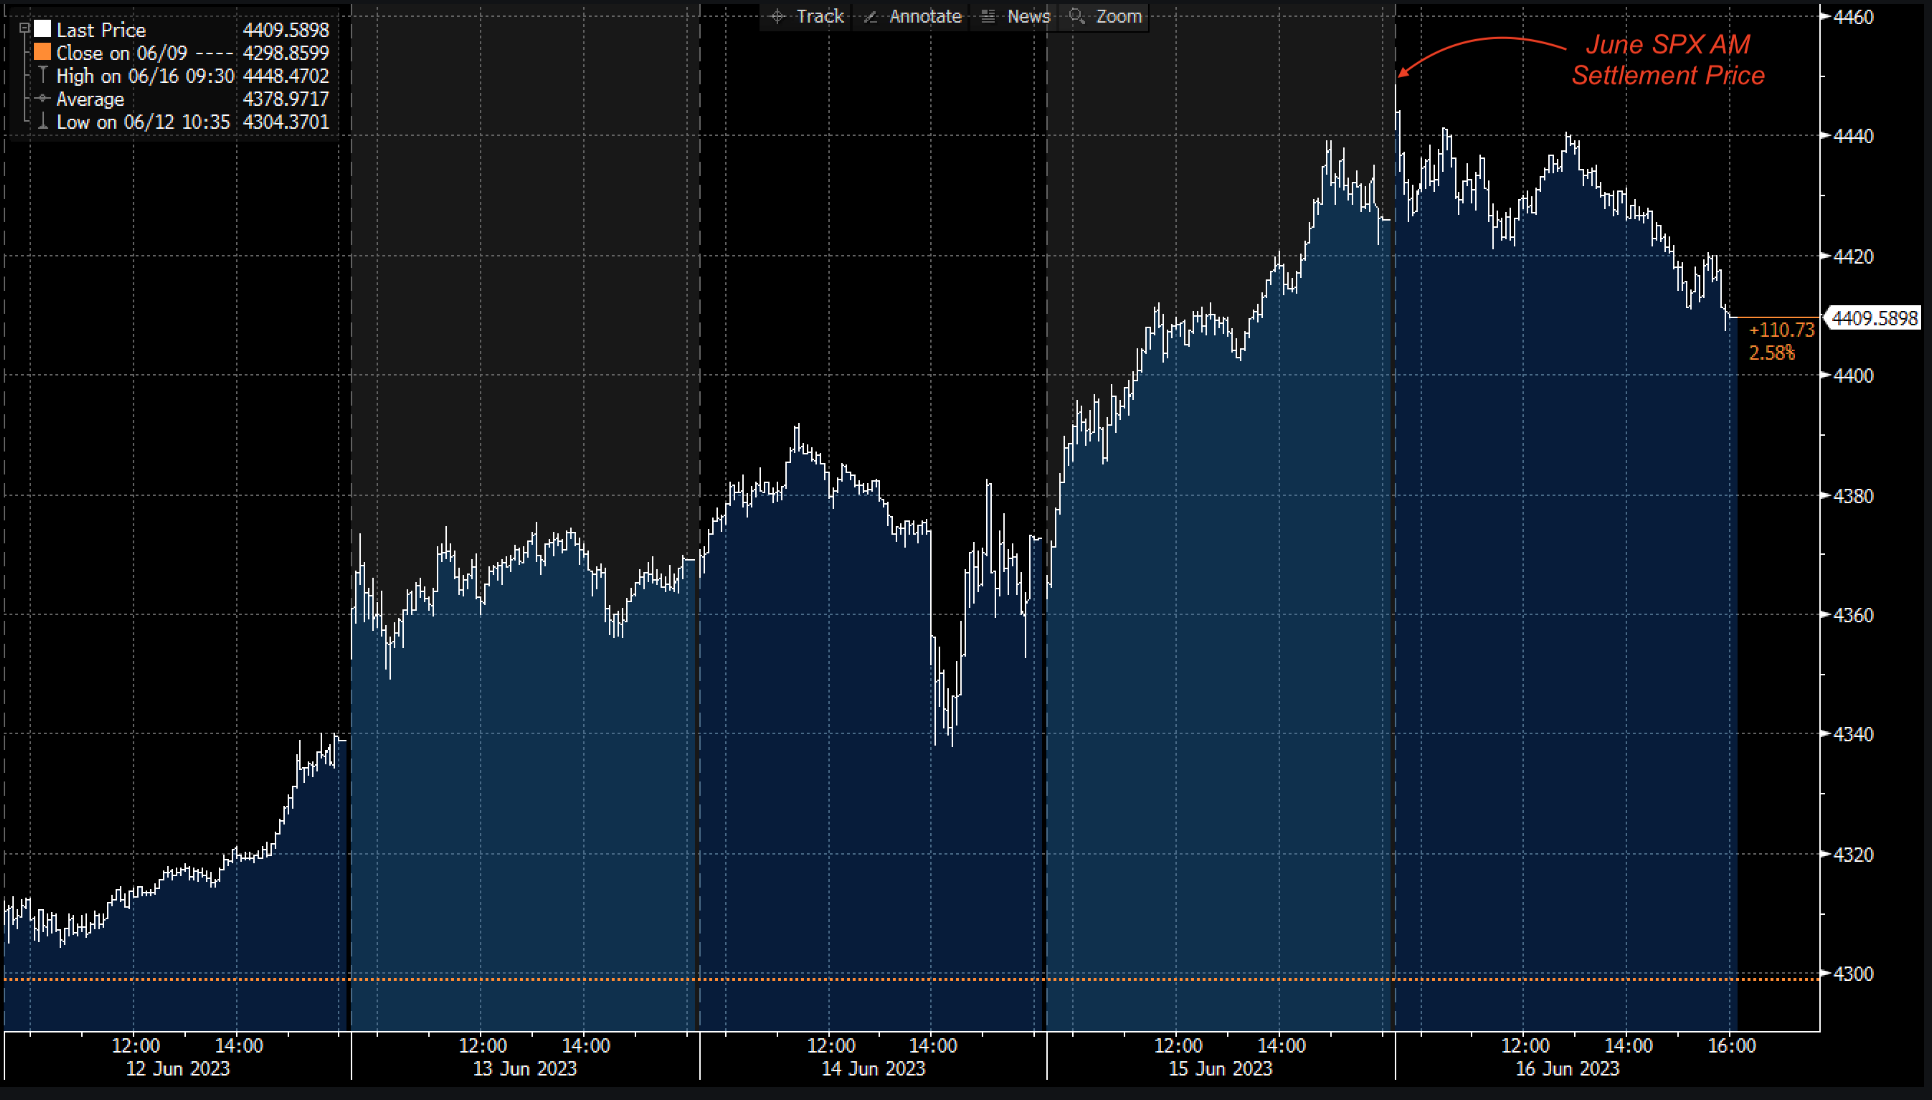
As Friday led to the reduction in call positions across both the single stock and Index space, we are now looking for consolidation in equities as associated call hedges are unwound. The value of call positions built up in conjunction with the S&P 5% return for the month, culminating in the SPX making its 1 year high, ironically, right on Fridays open. That opening level is, of course, the settlement price for the massive AM SPX expiration.
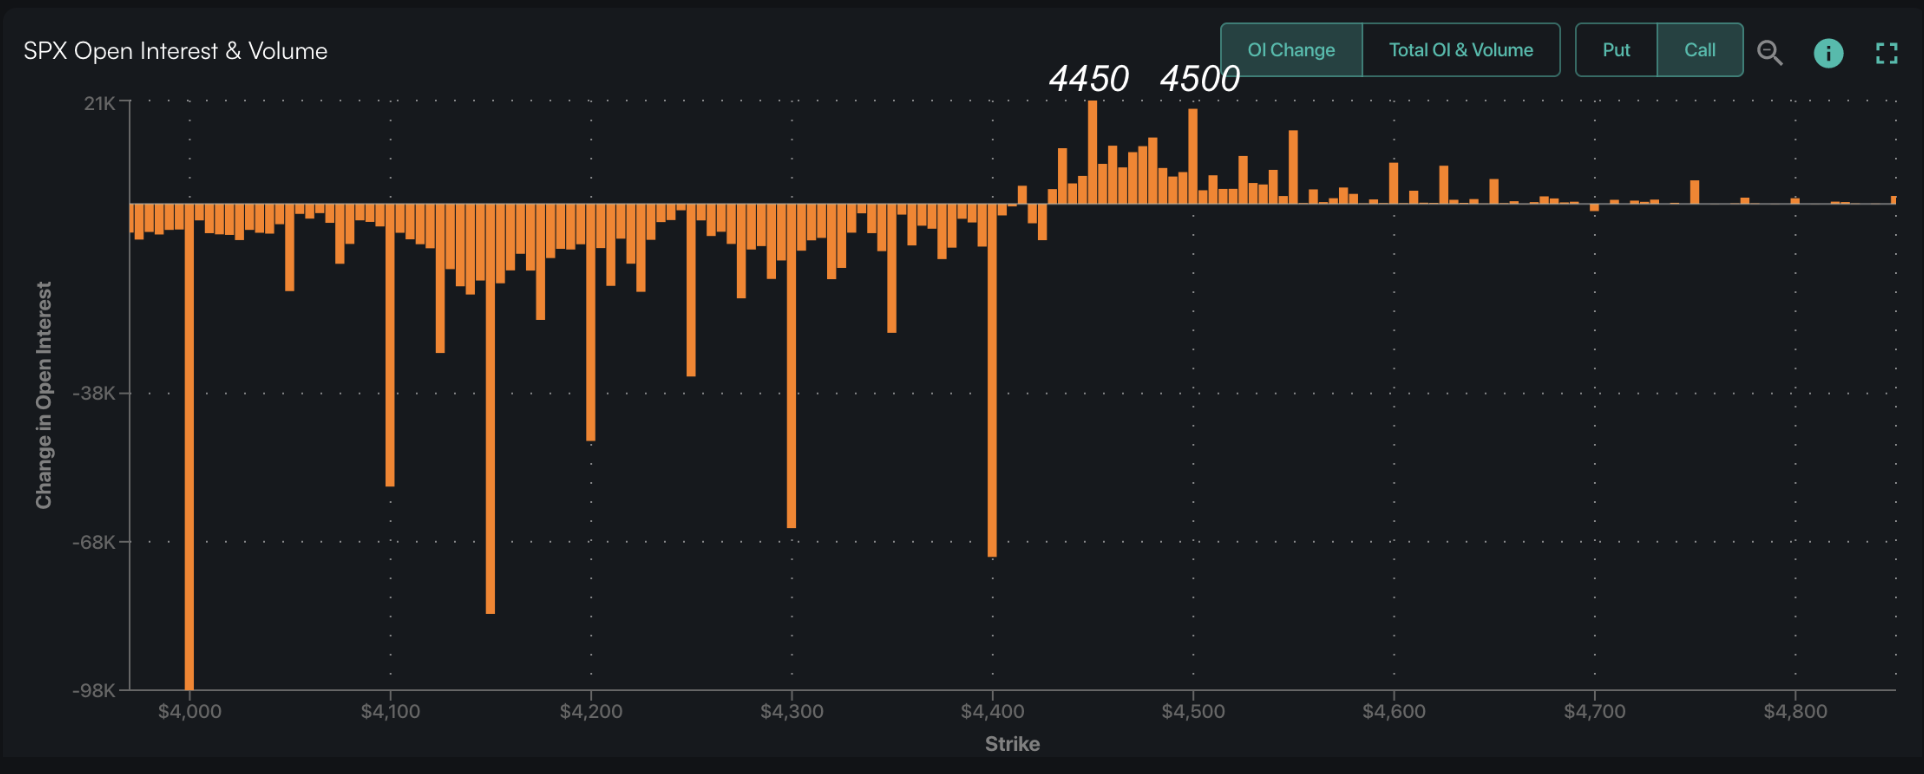
The result of that expiration was that large deep in-the-money call positions were closed (negative gamma bars, below) and traders rolled to new, higher strikes. With this, we see estimated dealer exposures “across the greeks” (delta, gamma, theta, etc) as reduced. This is true not only for the indicies, but equities across the board.
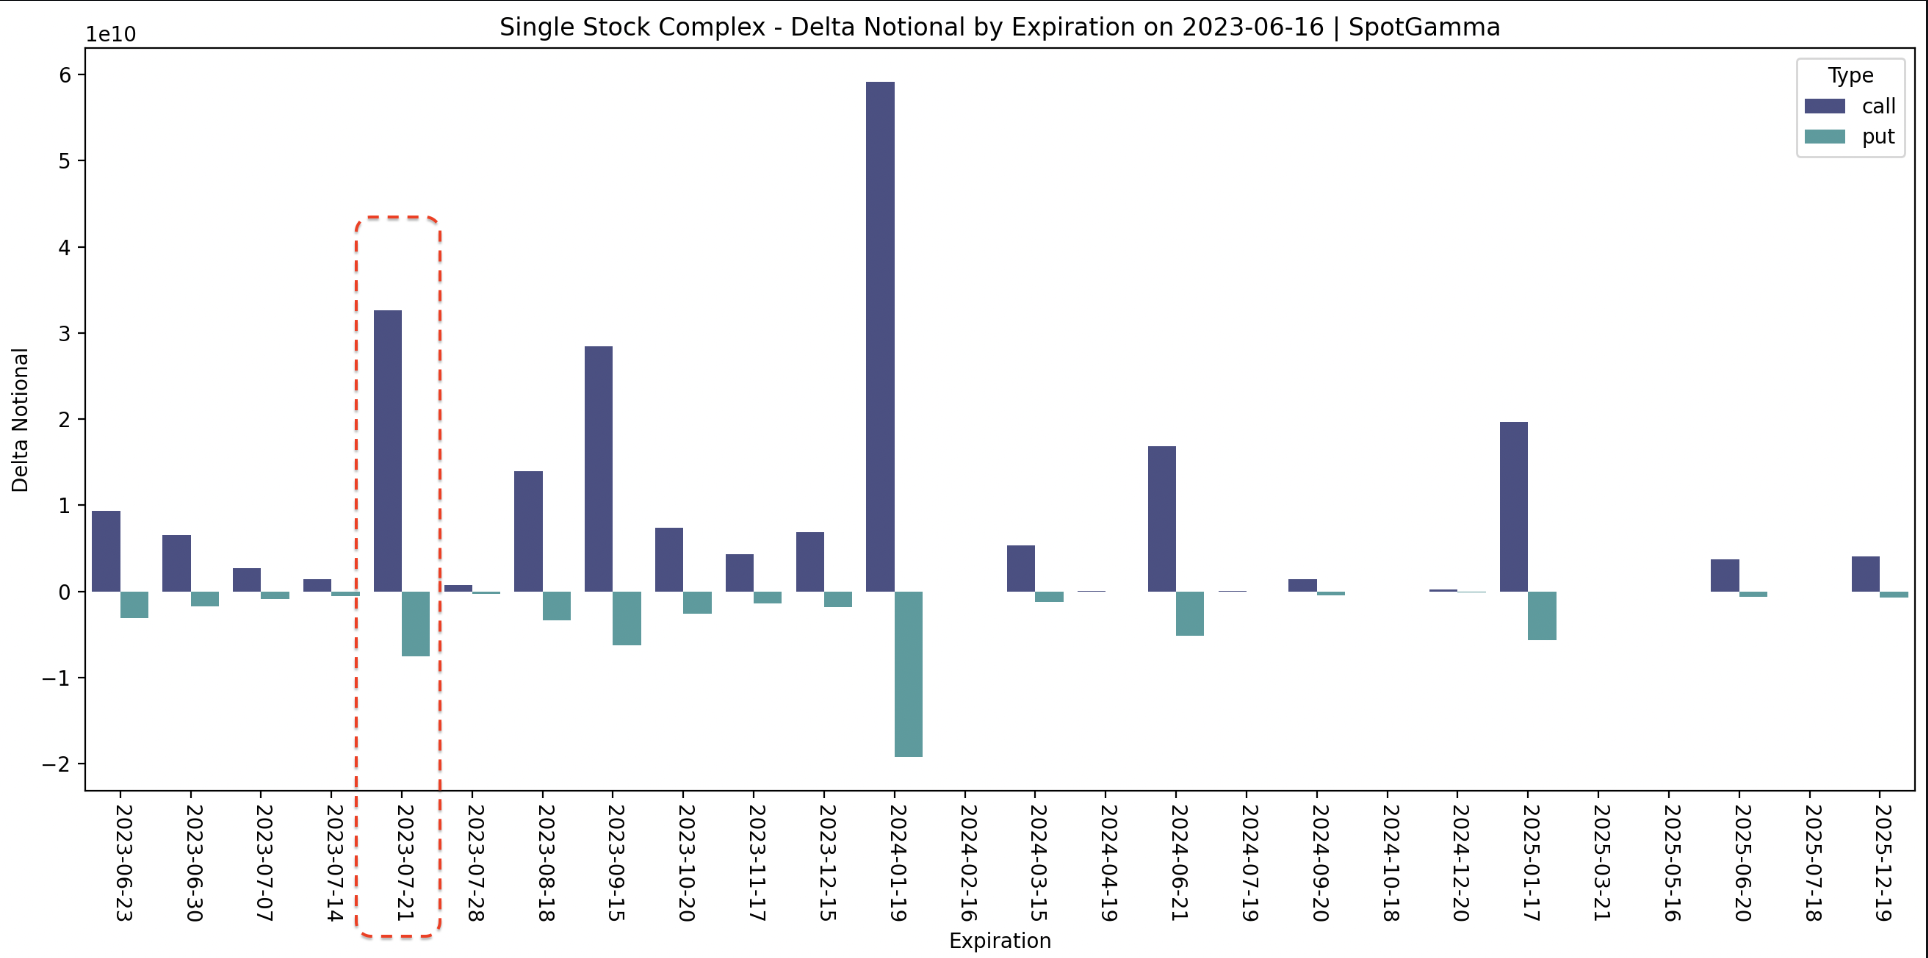
July is now the nearest expiration with any material single stock options exposure, however this exposure is ~50% that of June’s. If you believe, like us, that larger call positions drive dealer hedging flows (i.e. buying futures/stock), then these call positions now have to rebuild in order for markets to gain the same momentum that was into place pre-OPEX.
Note that on the the Index side, attention likely turns to the 4,320 JPM call strike area which expires on 6/30. Gamma builds for this strike as time shifts towards 6/30 – but also if the S&P price starts to slide lower to that strike. This makes it a major downside price target into 6/30 OPEX.
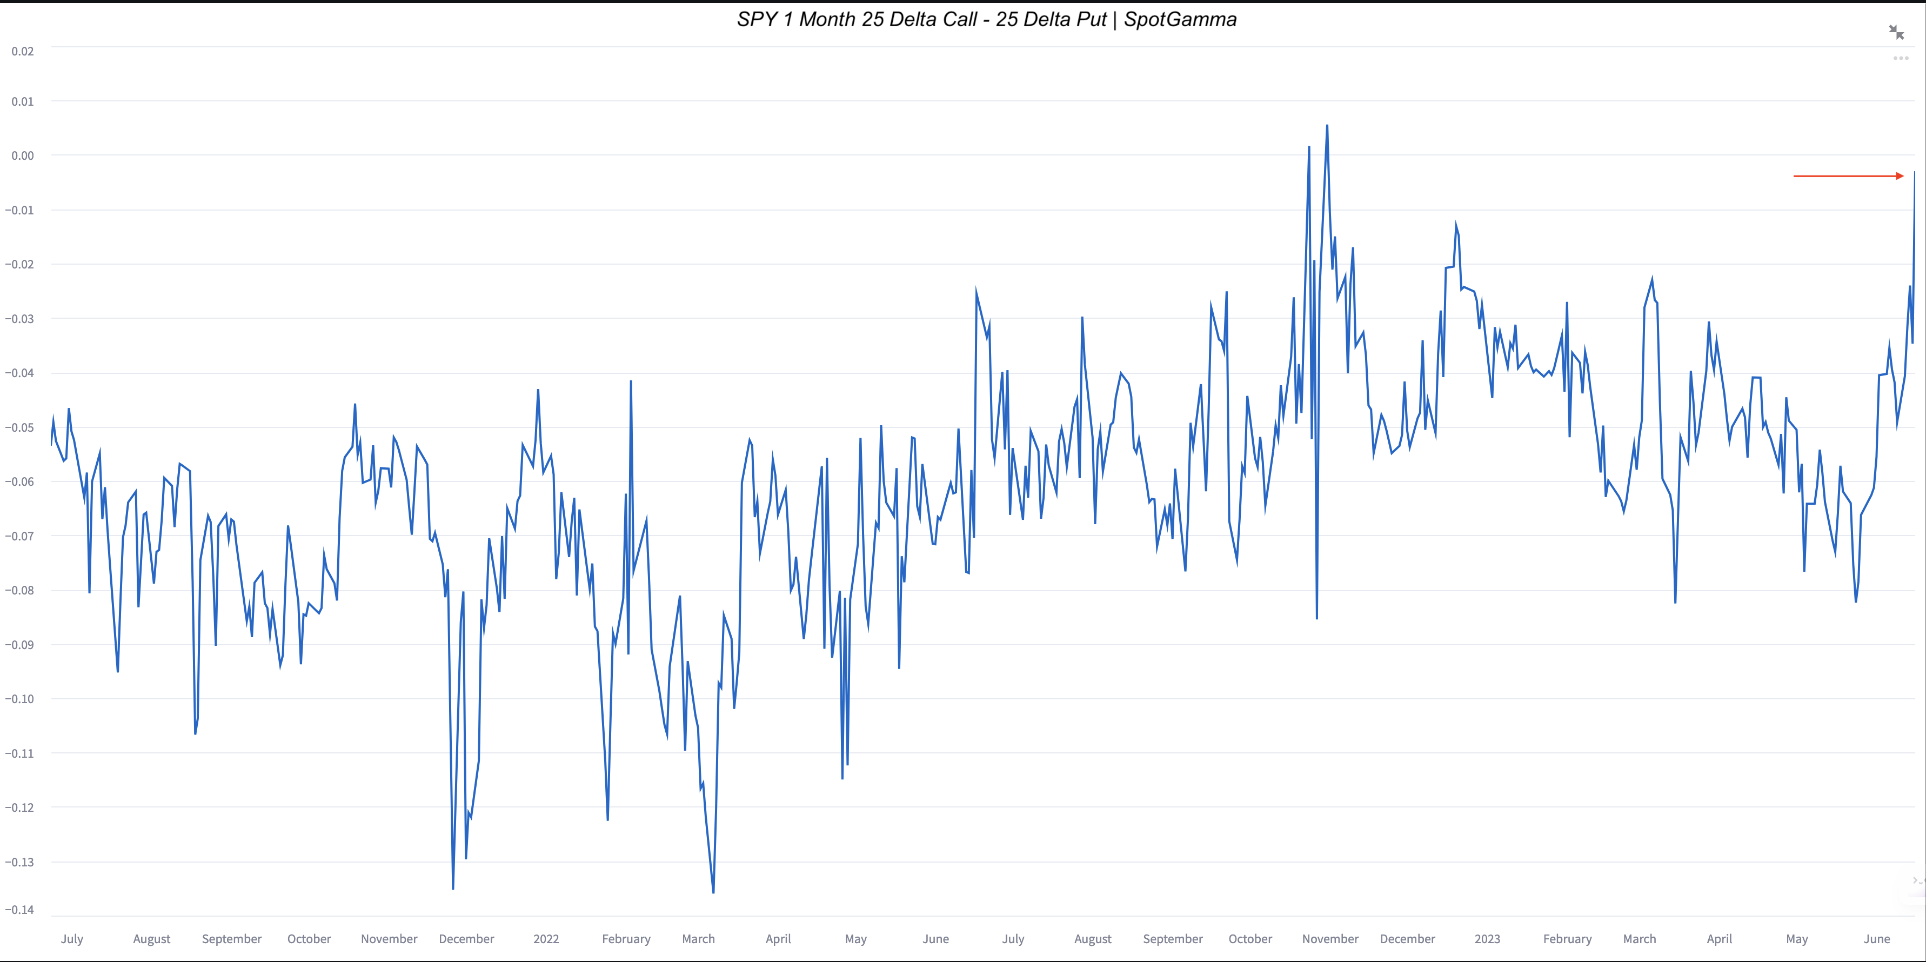
With this, we are looking for a cooling in the implied volatility of upside strikes. One of the defining characteristics of the latest rally has been “stocks up, vol up” as traders reached for call exposure.
We’ve showed many of these risk reversal charts, shown below, over the last few weeks as they hightlight the demand for calls over puts.
As these call IV’s increase, they require more and more upside volatility and/or demand in order to earn that higher IV. At some point these prices are unlikely to pay out even if you are directionality correct. Our view is that we are now at that point.
To simplify our views we’ve laid out the map below. While we are anticipating market weakness, that only kicks in on a downside break of 4,400. Should the SPX push below this level, we look for a test of 4,320.
| SpotGamma Proprietary Levels | SPX | SPY | NDX | QQQ | RUT | IWM |
|---|---|---|---|---|---|---|
| Reference Price: | $4409 | $439 | $15083 | $367 | $1875 | $185 |
| SpotGamma Implied 1-Day Move: | 0.88% | 0.88% |
|
|
|
|
| SpotGamma Implied 5-Day Move: | 2.32% |
|
|
|
|
|
| SpotGamma Volatility Trigger™: | $4295 | $441 | $15000 | $368 | $1850 | $186 |
| Absolute Gamma Strike: | $4400 | $440 | $15200 | $370 | $1880 | $180 |
| SpotGamma Call Wall: | $4500 | $442 | $15200 | $370 | $1880 | $190 |
| SpotGamma Put Wall: | $4000 | $439 | $15000 | $325 | $1750 | $170 |
| Additional Key Levels | SPX | SPY | NDX | QQQ | RUT | IWM |
|---|---|---|---|---|---|---|
| Zero Gamma Level: | $4318 | $438 | $13643 | $367 | $1899 | $187 |
| Gamma Tilt: | 1.454 | 0.786 | 2.571 | 0.944 | 0.902 | 0.818 |
| SpotGamma Gamma Index™: | 1.679 | -0.186 | 0.076 | -0.017 | -0.005 | -0.025 |
| Gamma Notional (MM): | $659.616M | ‑$673.87M | $8.803M | ‑$73.988M | ‑$4.708M | ‑$222.441M |
| 25 Day Risk Reversal: | -0.02 | -0.006 | -0.009 | -0.017 | -0.01 | -0.001 |
| Call Volume: | 644.55K | 2.375M | 17.836K | 773.546K | 26.727K | 363.725K |
| Put Volume: | 1.178M | 2.733M | 12.505K | 1.163M | 33.627K | 535.578K |
| Call Open Interest: | 5.468M | 5.867M | 53.149K | 3.966M | 167.239K | 3.29M |
| Put Open Interest: | 11.234M | 12.635M | 56.372K | 8.685M | 295.85K | 6.68M |
| Key Support & Resistance Strikes |
|---|
| SPX Levels: [4500, 4450, 4400, 4300] |
| SPY Levels: [442, 440, 435, 430] |
| NDX Levels: [15200, 15150, 15125, 15000] |
| QQQ Levels: [370, 365, 360, 350] |
| SPX Combos: [(4599,95.67), (4577,85.17), (4551,94.77), (4524,94.50), (4515,81.42), (4502,99.22), (4493,73.77), (4489,74.48), (4480,78.54), (4476,96.49), (4471,87.04), (4467,80.86), (4458,88.25), (4454,81.78), (4449,99.08), (4445,87.55), (4440,88.42), (4436,91.96), (4432,77.27), (4423,92.04), (4405,82.96), (4401,93.79), (4396,82.72), (4383,81.22), (4374,90.28), (4348,77.81), (4321,96.49), (4313,74.39), (4299,82.67), (4198,90.32)] |
| SPY Combos: [448.67, 443.39, 446.03, 430.65] |
| NDX Combos: [15205, 15174, 15371, 15582] |
| QQQ Combos: [370.84, 370.11, 374.89, 380.04] |
0 comentarios