
Macro Theme:
Short Term Resistance: 4,450 – 4,465 (SPY 445 Call Wall)
Short Term Support: 4,415 (SPY 440) – 4,400
Risk Pivot Level: 4,400
Major Range High/Resistance: 4,500 Call Wall
Major Range Low/Support: 4,200 Put Wall
‣ We maintain a bullish stance while the SPX is >4,400 and below the 4,500 Call Wall (updated: 7/3/23)
‣ We anticipate declining market volatility into 7/21 July OPEX (updated: 7/3/23)
‣ A downside break of 4,400 is our “risk off” signal (updated: 7/3/23)
Founder’s Note:
Futures were flat overnight, with the ES currently trading at 4,445. Key SG levels are largely unchanged, with resistance above at 4,415 (SPY 440), followed by 4,450. Support below shows at 4,400, then 4,359.
In QQQ the
Call Wall
has contracted again, this time to 370 (from 372). 370 level is now major resistance, with support at 365.
Framing the macro situation here:
- Foreign markets were thrashed yesterday. For example the EuroStoxx50 was -3%, with similar moves lower in many Asian markets
- Big spike in bond volatility. The 10 year is up 20bps in 3 sessions.
Yesterday AM certainly seemed like a warning shot, as the SPX broke the critical 4,400 level shortly after the open, only to stage a sharp reversal after EU closed, back to SPY 440 (SPX 4,415). Further, most of the US market damage was done pre-open, with futures trading down ~80bps into the cash open.
This AM decline was sparked by strong AM jobs data which led to traders buying longer dated puts. You can see this in the purple
HIRO
signal below, which tracks put flow from all expirations. Accordingly, there was a very strong response in implied volatility as indicated by the VIX touching 17, intraday.
However, that pressure was all unwound after the 11:30AM ET, leading to an cash session change that was only -22bps. This mean reversion was led by strong 0DTE flows, as shown below in teal. Through our lens this mean reversion is that positive gamma & 0DTE mean reversion/vol suppression in top form.
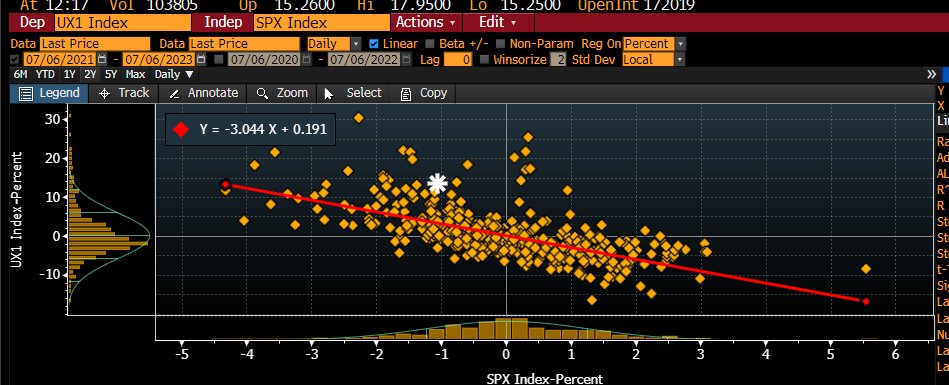
Back to that move in IV, it was initially very sharp relative to the SPX move. This is shown in plot below which compares the VIX futures move to SPX (h/t @danny_kirsch). This relatively large VIX move vs SPX helps to support the idea that there was some strong downside hedging demand in the first half of yesterdays session. We flag the SPX recovery after the EU close, as we wonder if some of that US AM volatility was correlated or linked to adjustments from international weakness.
The other source of equity volatility and/or hedging demand may be the result of the jumps in US rates. As shown below the MOVE index shifted significantly higher as traders adjust to better than expected US data. These higher rates likely serve as a drag on tech, but may also add to struggles in financials and REITs.
The net result of all this is that downside is indeed catching a bid, and we are starting to see upside IV’s cool off. As one indication of this, we’ve plotted 1 month SPX skew wherein you can see these downside strikes shifting higher.
We’d argue that the 440SPY/4,400SPX level held things together yesterday and we continue to mark this as a critical
pivot
level. As discussed yesterday this strike should “put up a fight”, but as you shift below that line negative gamma starts to increase. As long as the SPX maintains the 4,400 level, gamma flows should continue to suppress volatility.
| SpotGamma Proprietary Levels | SPX | SPY | NDX | QQQ | RUT | IWM |
|---|---|---|---|---|---|---|
| Reference Price: | $4411 | $439 | $15089 | $367 | $1842 | $182 |
| SpotGamma Implied 1-Day Move: | 0.84% | 0.84% |
|
|
|
|
| SpotGamma Implied 5-Day Move: | 2.13% |
|
|
|
|
|
| SpotGamma Volatility Trigger™: | $4410 | $439 | $14825 | $368 | $1850 | $182 |
| Absolute Gamma Strike: | $4400 | $440 | $15200 | $370 | $1880 | $180 |
| SpotGamma Call Wall: | $4500 | $450 | $15200 | $370 | $1880 | $190 |
| SpotGamma Put Wall: | $4200 | $420 | $14475 | $360 | $1820 | $180 |
| Additional Key Levels | SPX | SPY | NDX | QQQ | RUT | IWM |
|---|---|---|---|---|---|---|
| Zero Gamma Level: | $4386 | $439 | $14171 | $369 | $1865 | $186 |
| Gamma Tilt: | 1.169 | 0.891 | 2.545 | 0.899 | 0.746 | 0.672 |
| SpotGamma Gamma Index™: | 0.826 | -0.102 | 0.103 | -0.037 | -0.023 | -0.058 |
| Gamma Notional (MM): | $231.151M | ‑$413.182M | $12.467M | ‑$248.081M | ‑$23.254M | ‑$581.724M |
| 25 Day Risk Reversal: | -0.043 | -0.038 | -0.033 | -0.034 | -0.034 | -0.032 |
| Call Volume: | 554.203K | 2.052M | 7.797K | 682.245K | 38.147K | 505.839K |
| Put Volume: | 942.84K | 2.672M | 10.984K | 1.335M | 65.108K | 880.955K |
| Call Open Interest: | 5.746M | 6.432M | 57.634K | 4.154M | 212.479K | 3.594M |
| Put Open Interest: | 12.079M | 13.61M | 66.542K | 9.136M | 380.661K | 7.081M |
| Key Support & Resistance Strikes |
|---|
| SPX Levels: [4500, 4450, 4400, 4300] |
| SPY Levels: [442, 440, 438, 435] |
| NDX Levels: [15200, 15150, 15125, 15000] |
| QQQ Levels: [370, 365, 363, 360] |
| SPX Combos: [(4601,96.81), (4575,89.04), (4548,96.44), (4526,95.16), (4517,81.55), (4500,99.45), (4495,77.67), (4491,78.07), (4487,78.46), (4482,82.09), (4473,97.56), (4469,79.36), (4465,87.96), (4460,85.98), (4456,91.42), (4451,98.84), (4447,75.31), (4438,84.91), (4434,93.03), (4429,79.83), (4425,90.47), (4416,79.61), (4394,87.29), (4385,85.77), (4381,77.95), (4359,89.04), (4350,79.35), (4345,88.12), (4315,75.29), (4301,74.42), (4248,87.79), (4213,84.19), (4209,79.37), (4200,94.11)] |
| SPY Combos: [444.95, 442.31, 440.11, 449.78] |
| NDX Combos: [15195, 15150, 15271, 15602] |
| QQQ Combos: [367.26, 369.1, 372.03, 376.81] |
0 comentarios