Macro Theme:
Short Term Resistance: 4,450 – 4,465 (SPY 445 Call Wall)
Short Term Support: 4,415 (SPY 440) – 4,400
Risk Pivot Level: 4,400
Major Range High/Resistance: 4,500 Call Wall
Major Range Low/Support: 4,200 Put Wall
‣ We maintain a bullish stance while the SPX is >4,400 and below the 4,500 Call Wall (updated: 7/3/23)
‣ We anticipate declining market volatility into 7/21 July OPEX (updated: 7/3/23)
‣ A downside break of 4,400 is our “risk off” signal (updated: 7/3/23)
Founder’s Note:
Futures are fractionally higher to 4,550. The
Call Walls
did not shift higher for any major Index/Index ETF (SPX/SPY/QQQ/IWM). We therefore are in an overbought condition while the S&P is above the 4,500 – 4,515 (SPY 450 Call Wall) range. Resistance lines above there show at 4,525. We look for support below at 4,474, 4,465 (SPY 445) & 4,450.
Major QQQ resistance remains at 380, with support at 375.
The S&P500 continues to exhibit tight intraday trading ranges, with a 40bp cash open/close move yesterday. We continue to look for these tight trading ranges, with the SPX holding that key 4,500-4,515 resistance range. We also note the QQQ rejected off of its 380
Call Wall,
too (bottom pane). Our data suggests that the forward 5 day returns on an SPX Call Wall breach are near -20bps.
We note that after yesterday’s gain the QQQ & SPX are just 5% & 10%, respectively, from their all time highs.
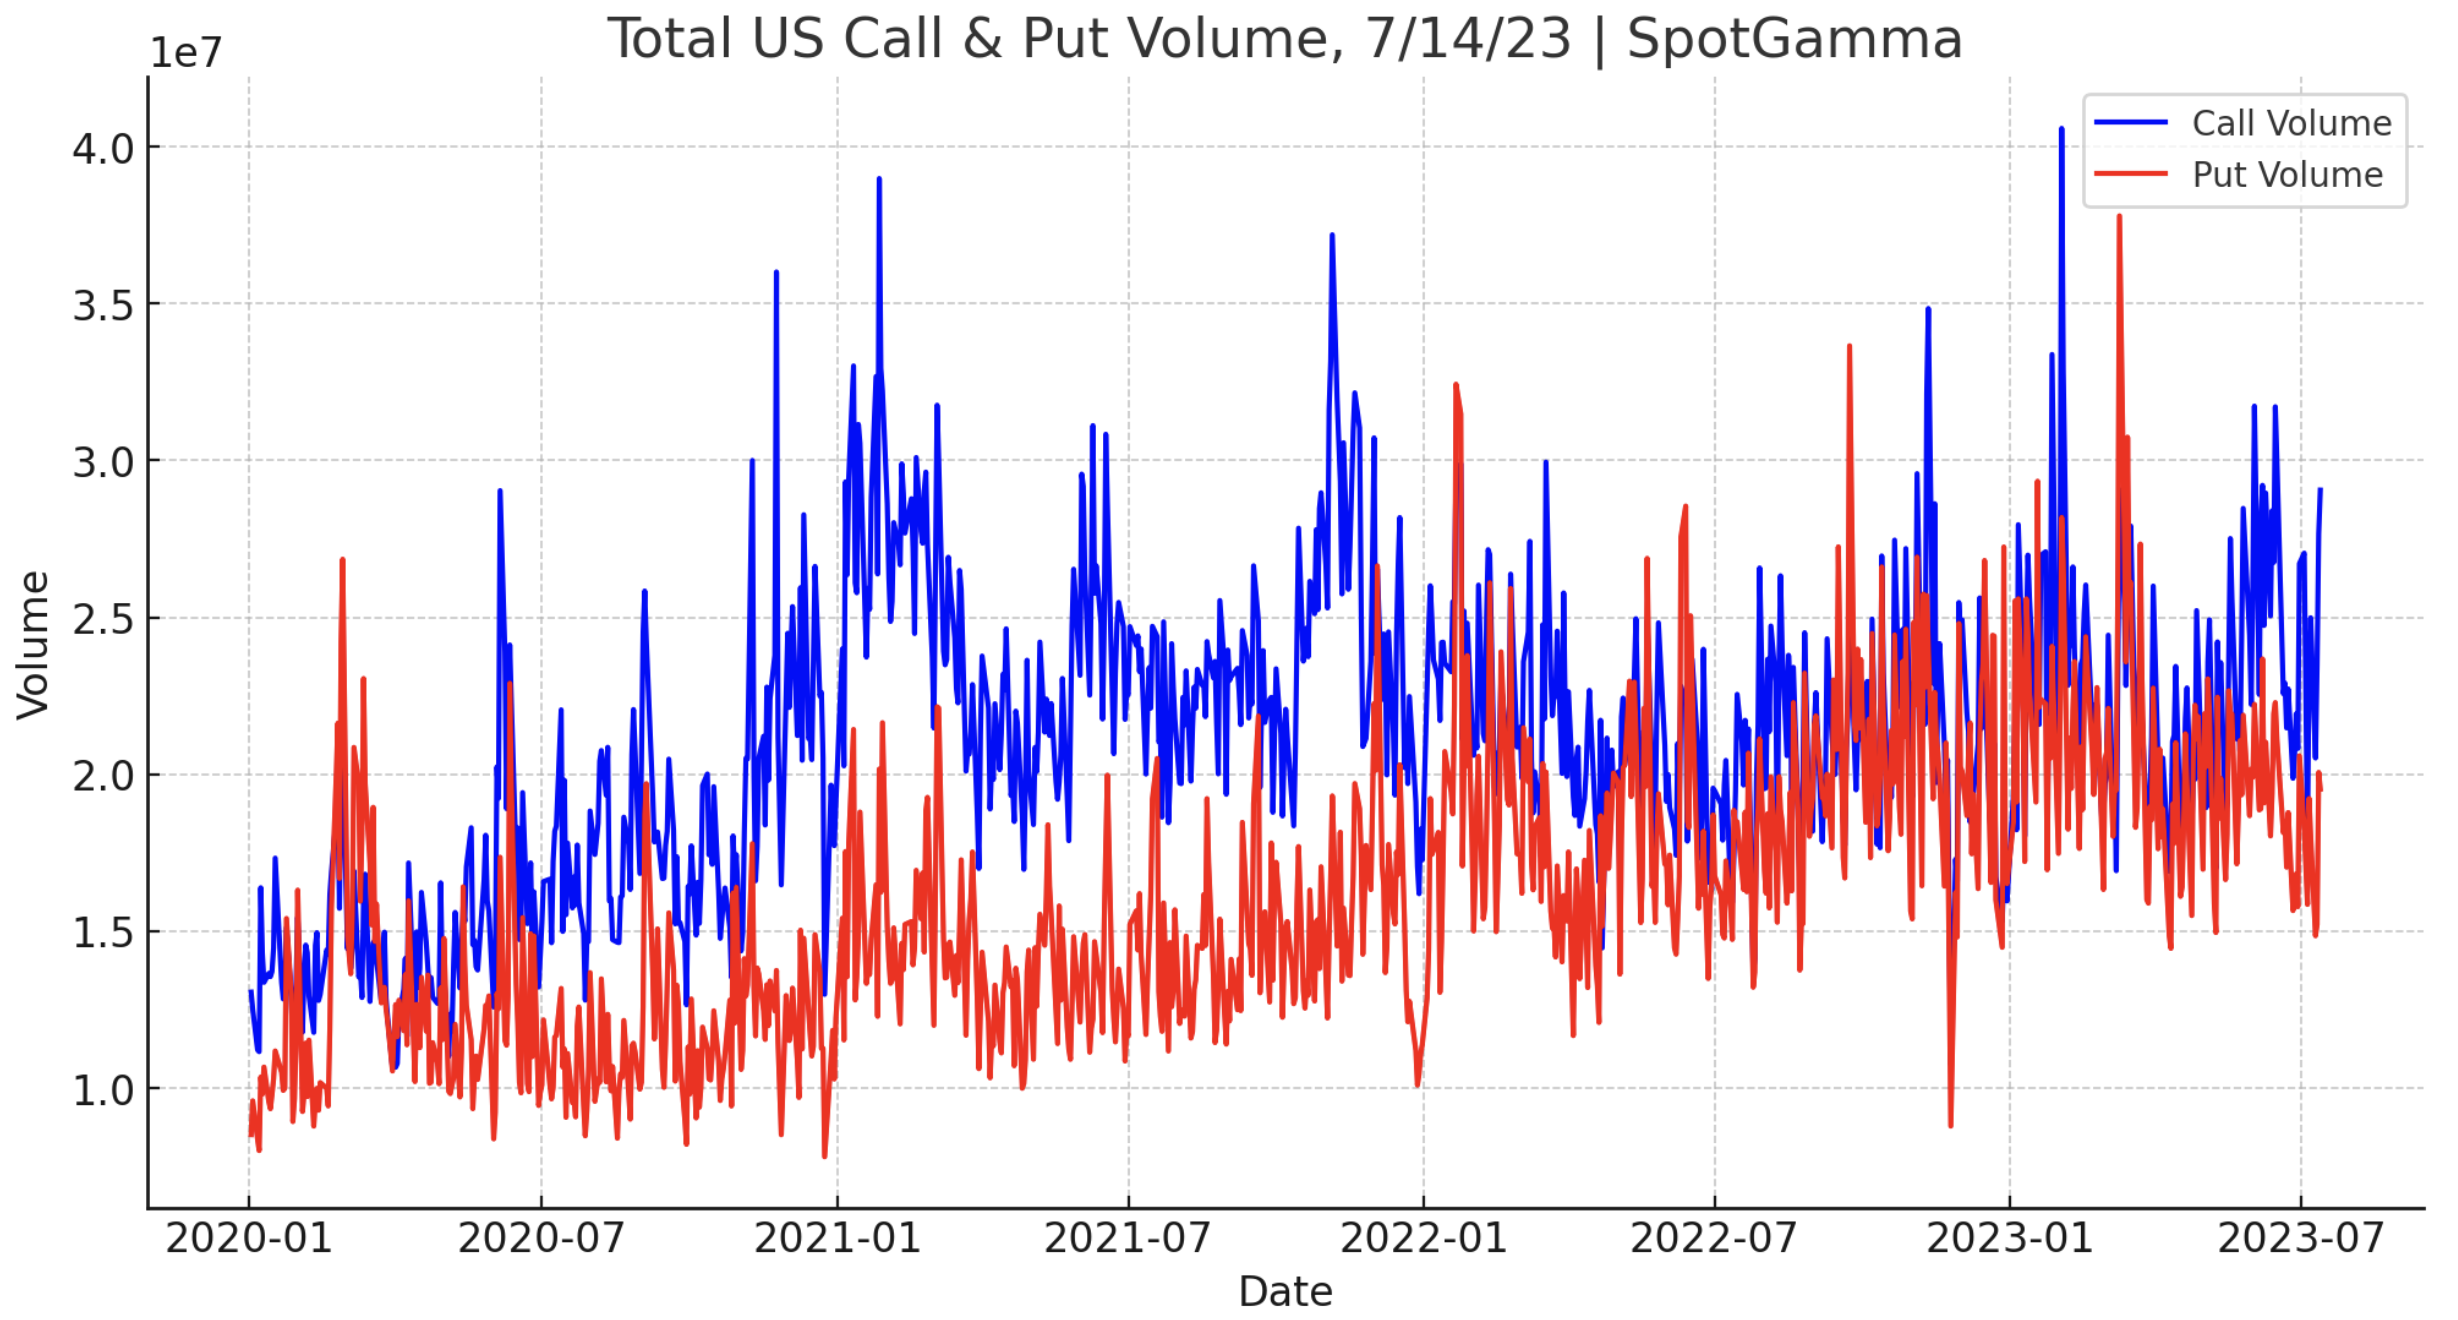
The larger moves were in single stocks. There was indeed a spike in
call volume,
primarily for single stocks, as shown below (blue). However, this is below that of the huge move in June and the massive 2/2/23 call day.
Index implied vol’s are obviously getting crushed, as the index continues to realized low volatility. This is obviously not true in single stocks, which remain high. You can see this dispersion through the CBOE 1 Month Correlation Index, which measures 1 month SPX IV vs single stock components. This index is now back to the record low VIX days of 2017. Eventually this correlation crush unwinds, and that likely manifests as a sharp equity decline wherein correlation snaps higher (i.e. all stocks sell off). The timing of that is, of course, the million dollar question and does not appear imminent.
This rise in equity prices is serving to drive the value of call positions higher, which may make next weeks OPEX more impactful. The imbalance and size of Index/ETF
call delta
(orange) expiring vs puts (blue) can be seen below.
Just a side note here…
Of course, not all market moves can be explained by options flows. Occasionally the moves feel a bit out of sync with the options market – as it does now. Generally when this happens some type of major macro flow is pushing markets. For extra credit here we wanted to flag the move in the DXY. By no means are we qualified to discuss the impact of a declining dollar on global assets – but we do recognize that volatility jumps across assets and a declining dollar is often associated with a rise in asset prices.
|
SpotGamma Proprietary Levels |
SPX |
SPY |
NDX |
QQQ |
RUT |
IWM |
|---|---|---|---|---|---|---|
|
Reference Price: |
$4510 |
$449 |
$15572 |
$379 |
$1950 |
$193 |
|
SpotGamma Implied 1-Day Move: |
0.82% |
0.82% |
|
|
|
|
|
SpotGamma Implied 5-Day Move: |
2.29% |
|
|
|
|
|
|
SpotGamma Volatility Trigger™: |
$4445 |
$448 |
$14840 |
$369 |
$1860 |
$187 |
|
Absolute Gamma Strike: |
$4500 |
$450 |
$15200 |
$380 |
$1950 |
$192 |
|
SpotGamma Call Wall: |
$4500 |
$450 |
$15200 |
$380 |
$1950 |
$195 |
|
SpotGamma Put Wall: |
$4200 |
$446 |
$13800 |
$330 |
$1800 |
$180 |
|
Additional Key Levels |
SPX |
SPY |
NDX |
QQQ |
RUT |
IWM |
|---|---|---|---|---|---|---|
|
Zero Gamma Level: |
$4417 |
$448 |
$14406 |
$373 |
$1860 |
$191 |
|
Gamma Tilt: |
1.615 |
1.101 |
3.063 |
1.243 |
1.674 |
1.149 |
|
SpotGamma Gamma Index™: |
2.488 |
0.089 |
0.116 |
0.070 |
0.038 |
0.019 |
|
Gamma Notional (MM): |
$931.382M |
$185.844M |
$13.98M |
$293.665M |
$31.271M |
$128.09M |
|
25 Day Risk Reversal: |
-0.032 |
-0.026 |
-0.03 |
-0.027 |
-0.027 |
-0.028 |
|
Call Volume: |
635.781K |
1.946M |
11.607K |
941.962K |
15.149K |
348.656K |
|
Put Volume: |
979.091K |
2.424M |
10.57K |
1.205M |
24.288K |
524.319K |
|
Call Open Interest: |
5.895M |
6.617M |
60.853K |
4.409M |
217.629K |
3.508M |
|
Put Open Interest: |
12.752M |
14.554M |
70.872K |
9.325M |
393.718K |
7.73M |
|
Key Support & Resistance Strikes |
|---|
|
SPX Levels: [4550, 4500, 4450, 4400] |
|
SPY Levels: [450, 449, 448, 445] |
|
NDX Levels: [15500, 15200, 15150, 15000] |
|
QQQ Levels: [380, 375, 370, 360] |
|
SPX Combos: [(4699,96.76), (4677,81.94), (4663,92.29), (4650,94.05), (4623,89.07), (4614,83.20), (4600,99.41), (4573,96.15), (4569,83.76), (4564,88.27), (4560,89.62), (4555,84.89), (4551,99.56), (4546,87.23), (4542,97.40), (4537,95.86), (4533,81.77), (4528,94.49), (4524,99.72), (4519,95.44), (4515,98.45), (4510,94.31), (4506,83.29), (4501,99.88), (4497,76.07), (4492,75.34), (4478,76.62), (4474,94.84), (4456,79.29), (4451,78.72)] |
|
SPY Combos: [452.23, 457.17, 454.92, 462.57] |
|
NDX Combos: [15198, 15603, 15806, 16024] |
|
QQQ Combos: [376.68, 381.62, 386.55, 391.86] |
