Macro Theme:
Short Term Resistance: 4,523
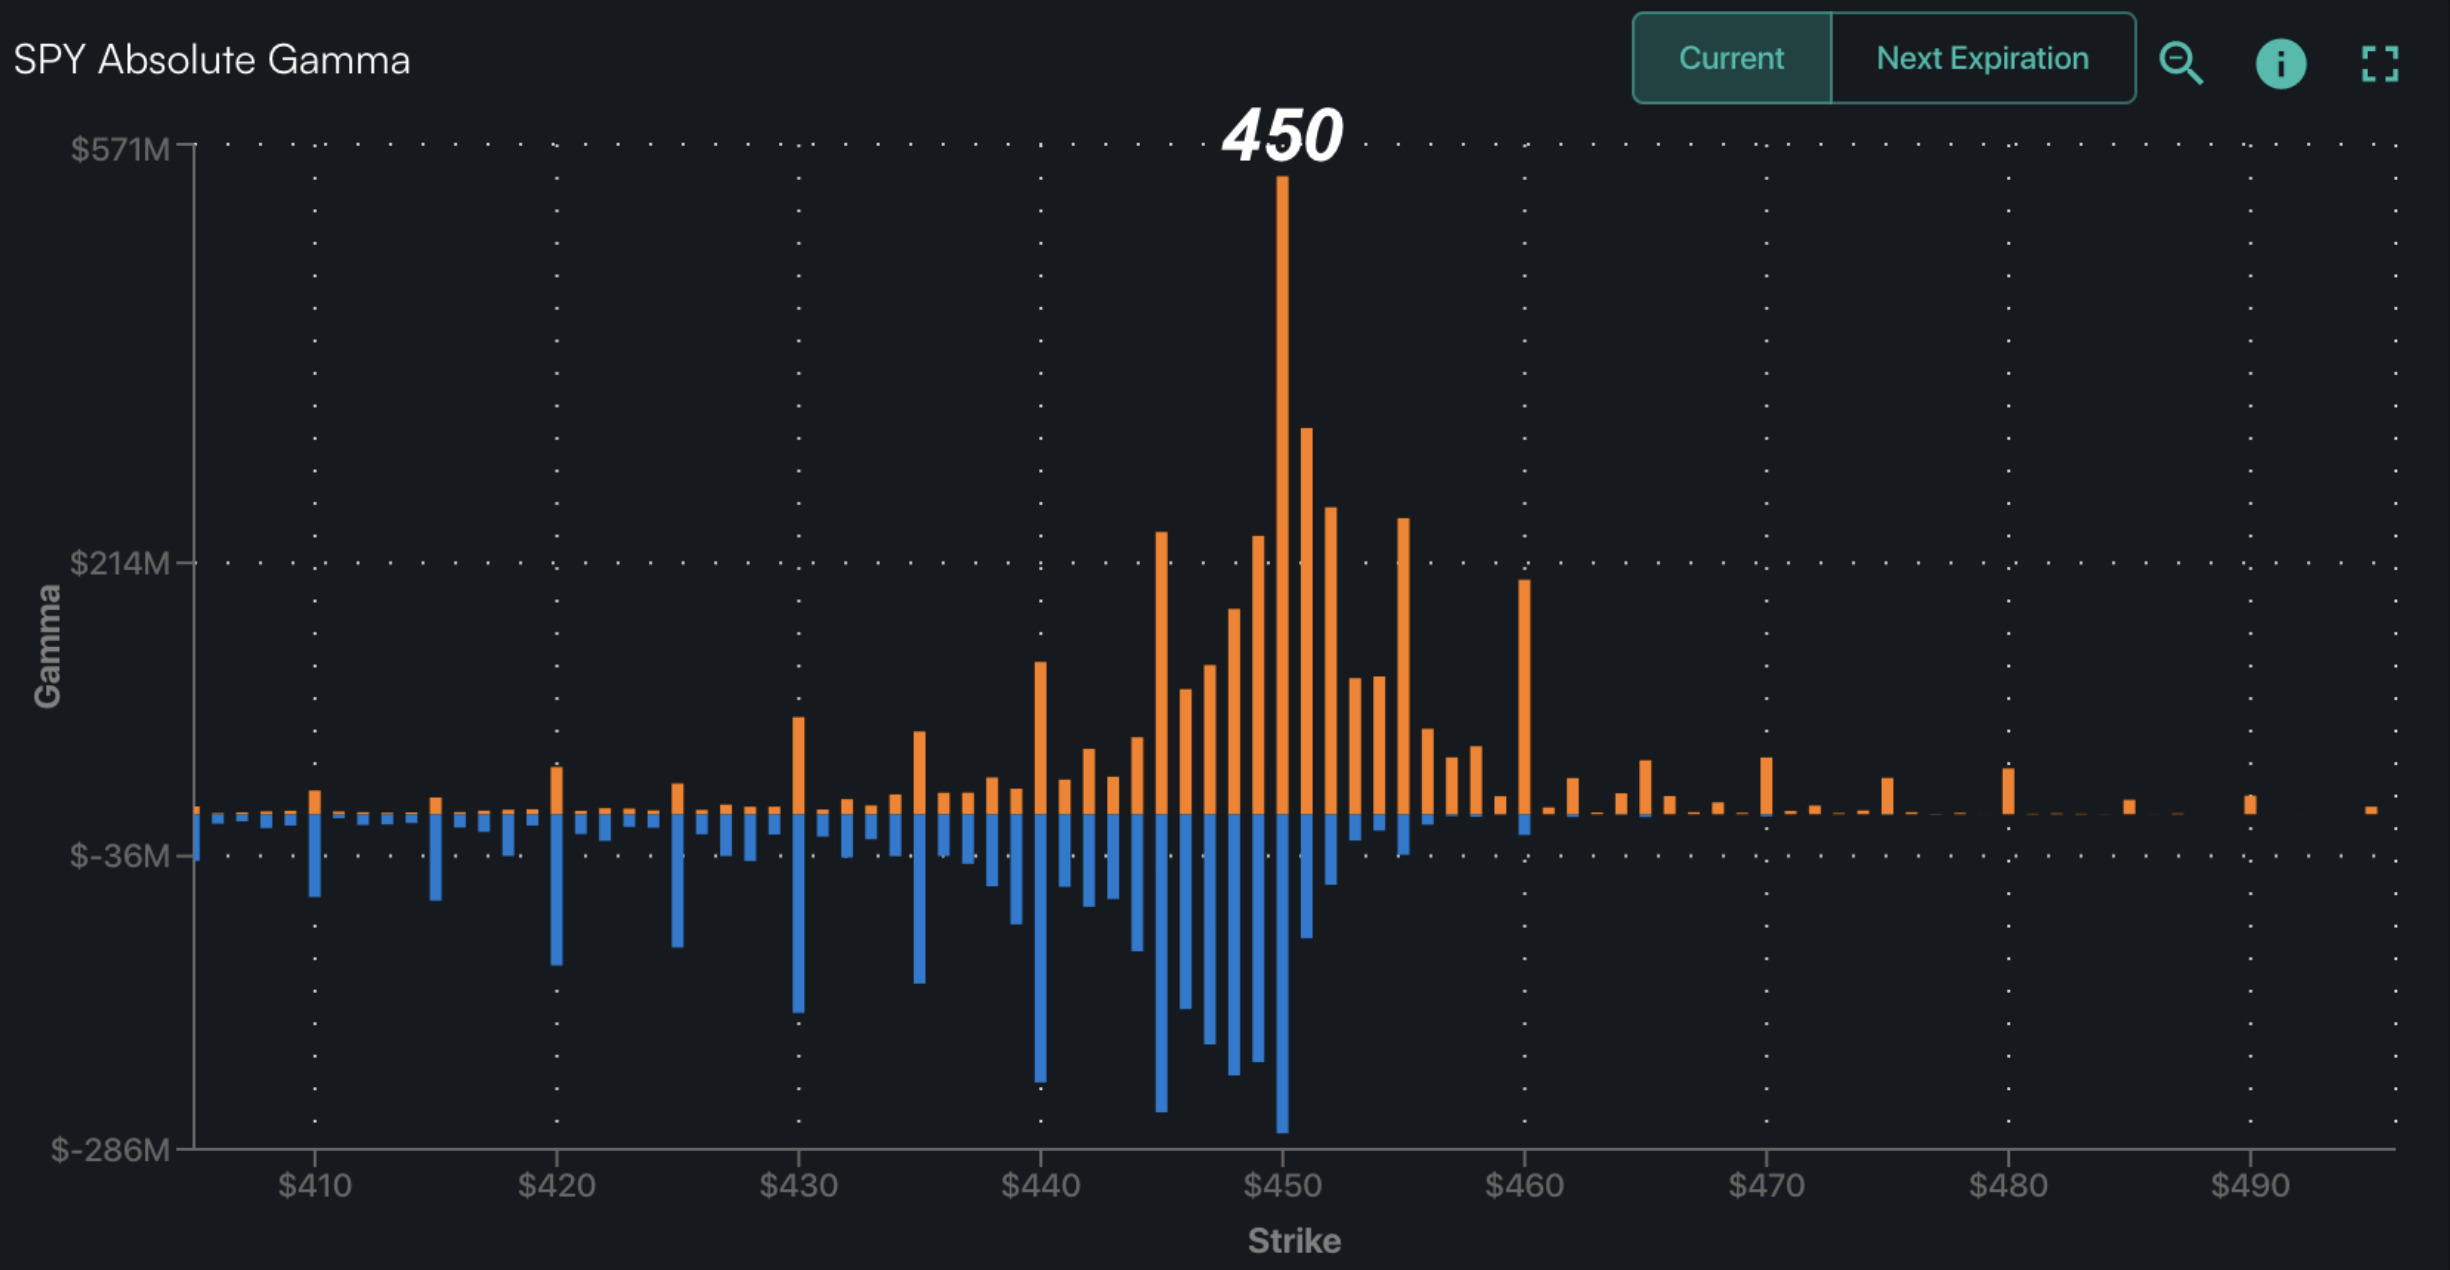
Short Term Support: 4,515 (SPY 440) – 4,500
Risk Pivot Level: 4,500
Major Range High/Resistance: 4,541
Major Range Low/Support: 4,300
‣ We look for low volatility on Monday, 7/17 & Tuesday 7/18 which supports the 4,500 level
‣ A window of weakness may open with 7/19 VIX expiration, in through the following week which may result in a break <4,500
Founder’s Note:
Futures are flat at 4,550. Levels are tightening in the 4,500-4,550 range, which adds to this as a resistance zone. Specifically 4,515 (SPY 450), 4,530 & 4,550 are resistance strikes. Support below is at 4,500. Low volatility is likely at play again, today.
In QQQ support is at 379, with resistance at 385.
Index volatility continues to drag along, with short dated ATM SPX IV around 10%. We continue to look for today as a local/short term “low” in volatility due to VIX expiration tomorrow, and equity OPEX on Friday.
Additionally, we added the SPX term structure from 11/3/2017 (green), which was the VIX all time closing low (9.14, vs 13.50 today).
Back in Nov ’17, 1 month realized volatility was at 4%(!) vs ~10% today. What that suggests is that a VIX of ~9 wasn’t all that unreasonable given the non-existent movement of the S&P500. To better frame this, we plotted out the difference between VIX & 1 month SPX realized volatility. As you can see, the long term average is around 3.5, which means if we’re today realizing 10% SPX volatility, then 13.5 VIX is average.
This is not to say that other aspects of the volatility space are now starting to get…weird.
We’ll preface this by saying that a lot of these indices have weird nuances – particularly when “indexifying” options/volatility products.
That being said, the SDEX is now at all time lows. Specifically, the SDEX Index is calculated by comparing the implied volatility of a 30-day at-the-money put option to the implied volatility of a 30-day out-of-the-money put option that is one standard deviation below the at-the-money strike price. Its a measure of put skew and/or hedging demand, and this all time low suggests demand has cratered.
The other index thats catching a lot of attention is correlation, which is now at lows going back to Q4 of 2017. As a refresher, this index measures the expected 1 month correlation between the SPX Index and its top 50 single stock components. The TLDR here is that if traders were looking for a crash, they’d be buying downside SPX hedges, which would spike the correlation index.
These metrics all tie back into demand for downside hedges and/or long volatility. At some we’re likely to see these metrics mean revert, and when they do so it likely leads to a rather sharp, episodic increase in volatility.
Timing is everything, and there is not a clear catalyst to force put demand & mean version in these indicies. However, one has to wonder if these metrics are reflecting that the “juice has been squeezed” which would be a warning for the short index vol crowd.
|
SpotGamma Proprietary Levels |
SPX |
SPY |
NDX |
QQQ |
RUT |
IWM |
|---|---|---|---|---|---|---|
|
Reference Price: |
$4522 |
$450 |
$15713 |
$382 |
$1951 |
$193 |
|
SpotGamma Implied 1-Day Move: |
0.82% |
0.82% |
|
|
|
|
|
SpotGamma Implied 5-Day Move: |
2.30% |
|
|
|
|
|
|
SpotGamma Volatility Trigger™: |
$4470 |
$449 |
$15120 |
$379 |
$1860 |
$188 |
|
Absolute Gamma Strike: |
$4500 |
$450 |
$15500 |
$380 |
$1950 |
$190 |
|
SpotGamma Call Wall: |
$4550 |
$451 |
$15200 |
$385 |
$1950 |
$195 |
|
SpotGamma Put Wall: |
$4300 |
$449 |
$13800 |
$330 |
$1800 |
$170 |
|
Additional Key Levels |
SPX |
SPY |
NDX |
QQQ |
RUT |
IWM |
|---|---|---|---|---|---|---|
|
Zero Gamma Level: |
$4463 |
$450 |
$14757 |
$379 |
$1860 |
$192 |
|
Gamma Tilt: |
1.386 |
1.093 |
2.347 |
1.265 |
1.682 |
1.219 |
|
SpotGamma Gamma Index™: |
1.688 |
0.082 |
0.073 |
0.074 |
0.040 |
0.027 |
|
Gamma Notional (MM): |
$767.291M |
$117.373M |
$6.979M |
$239.401M |
$32.811M |
$176.795M |
|
25 Day Risk Reversal: |
-0.03 |
-0.026 |
-0.029 |
-0.026 |
-0.026 |
-0.023 |
|
Call Volume: |
479.621K |
1.431M |
14.557K |
693.896K |
26.172K |
381.125K |
|
Put Volume: |
992.691K |
1.878M |
10.645K |
902.017K |
29.584K |
295.042K |
|
Call Open Interest: |
5.874M |
6.088M |
57.536K |
4.005M |
224.933K |
3.569M |
|
Put Open Interest: |
12.973M |
14.569M |
73.599K |
9.432M |
405.53K |
7.699M |
|
Key Support & Resistance Strikes |
|---|
|
SPX Levels: [4550, 4500, 4450, 4400] |
|
SPY Levels: [452, 451, 450, 449] |
|
NDX Levels: [16000, 15500, 15200, 15000] |
|
QQQ Levels: [385, 382, 380, 370] |
|
SPX Combos: [(4699,97.36), (4677,85.27), (4663,92.65), (4649,95.17), (4627,88.69), (4613,85.48), (4600,99.39), (4577,97.18), (4568,92.20), (4563,89.42), (4559,92.41), (4554,87.01), (4550,99.74), (4545,91.64), (4541,96.08), (4536,95.88), (4532,81.30), (4523,99.24), (4518,81.11), (4514,89.38), (4505,79.61), (4500,98.42), (4496,77.96), (4473,81.08), (4455,76.53), (4450,78.43), (4423,83.08), (4301,90.69)] |
|
SPY Combos: [460.32, 455.36, 452.65, 450.4] |
|
NDX Combos: [15808, 15603, 15729, 16012] |
|
QQQ Combos: [374.11, 389.05, 383.69, 394.02] |
