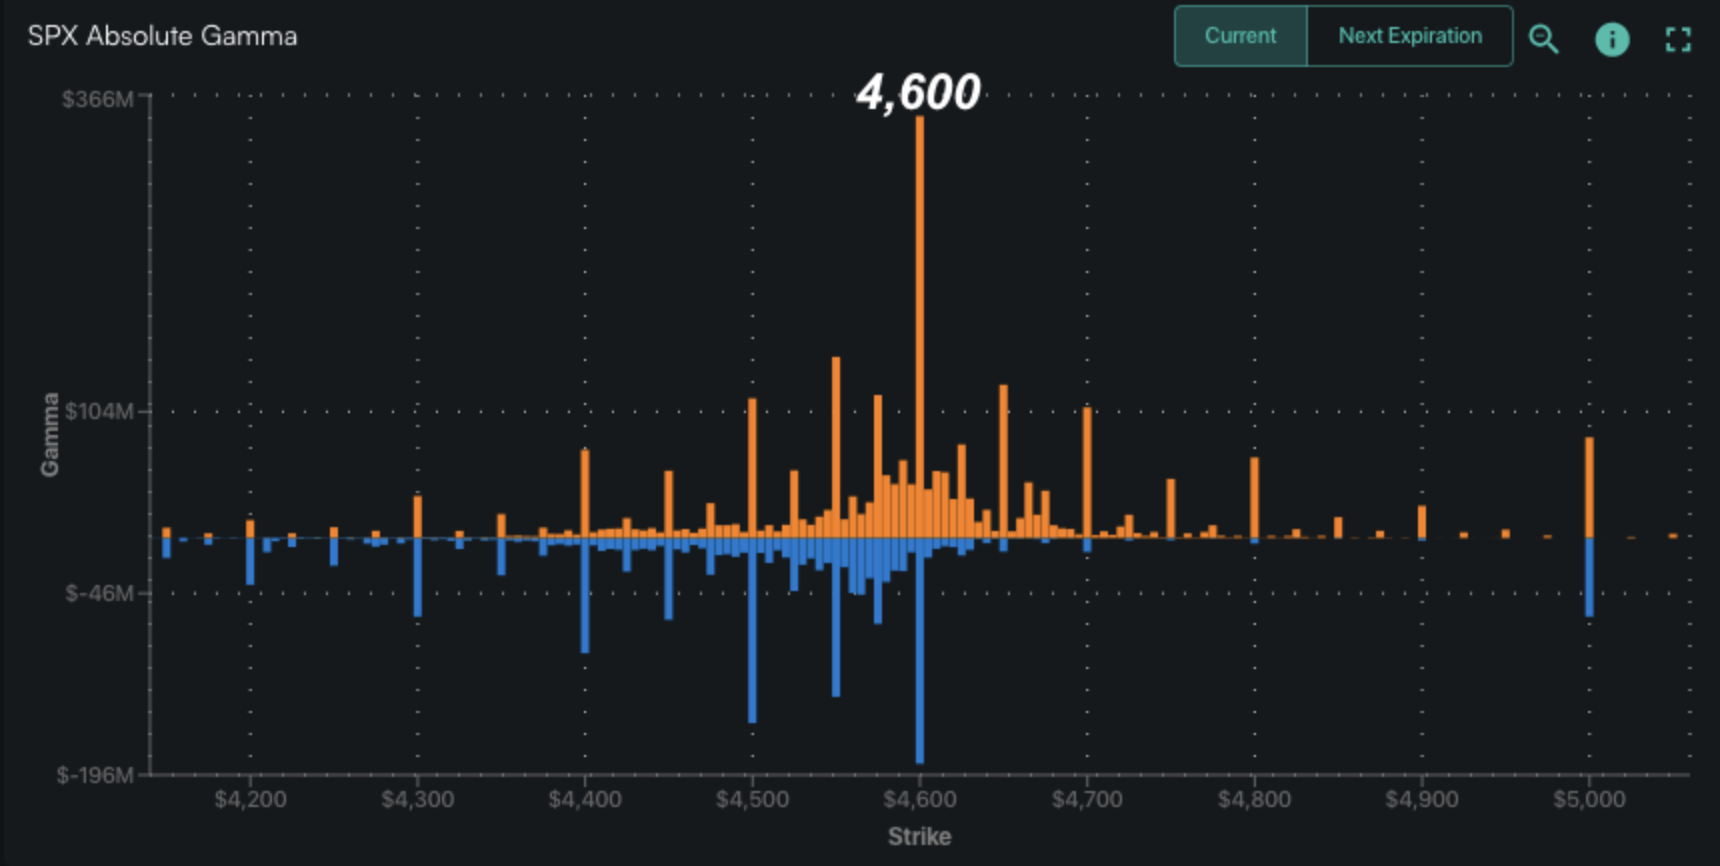
Macro Theme:
Short Term Resistance: 4,600 Call Wall – 4,615 (SPY 460 Call Wall)
Short Term Support: 4,550
Risk Pivot Level: 4,500 – 4,515 (SPY 450)
Major Range High/Resistance: 4,615
Major Range Low/Support: 4,400
‣ The bullish case remains intact with SPX >4,500* and a current upside target of the major 4,600 Call Wall**
‣ As realized volatility shifts lower, it suggests implied volatility should grind down, too. This may result in mid-12 VIX.**
‣ Risk shifts higher on a break of 4,500, wherein we would look for a test of 4,400 with a VIX shift towards 20*
*updated 7/24
**updated 7/27
Founder’s Note:
Futures are flat to 4,600. Key SG levels are unchanged, with major resistance at the 4,600-4,615 (SPY 460)
Call Wall
(s). Support below is at 4,565 (SPY 455) & 4,550. Our volatility forecasts continue to grind lower as the S&P moves into 4,600.
In QQQ major resistance is at the 385
Call Wall.
First support is at 380-381, with major support at the 375
Put Wall.
Based on the positive gamma environment and declining volatility we are on the lookout for the
Call Wall
(s) to roll higher which would unlock further equity market upside. The current
Call Wall
of 4,600 is a very large level which suggests it will take several sessions for positions to build overhead.
What we are watching for is the S&P re-testing this
Call Wall
level, and for the Wall to then shift to a higher strike. 4,600 would then become a base of support, and we’d look for equity market drift up to the next
Call Wall
strike. Should the
Call Wall
(s) fail to roll higher, then we view the equity market as topped out.
While things may be stalled, we see little in positioning that supports a strong, sustained sell off. That view is unlikely to change until/unless either:
- 4,500 is broken
- OPEX removes some positive gamma positioning
While we see the index side as sticky/sluggish, we see some fading in single stock enthusiasm. This can be seen through the OCC data, which, on a weekly basis tallies the sum of options bought and sold. Through this data we can see that equity call buying (blue) declined sharply, with a relative pop in put buying (orange).
The equity market returns following periods of net put buying are rather interesting. Pre-2021 the returns were distinctly positive, but after 2021 they appear to be negative.
After Jan ’21, the average 5 day return following a week of net positive put premium (20 such instances) is -2.52% (13/20), and 10 day return is -3.22% (12/20). Based on this data, the odds here seem to support a weaker market over the next 1-2 weeks. Added into the mix are Thursday’s earnings reports from AAPL & AMZN & Thursday/Friday jobs numbers.
The summary of this all seems to support looking for “flattish” equity markets in the short term which, for the SPX/NDX, may lead to mean reversion strategies working better than directional plays. While equities may end up flat to modeslty lower, we look for volatility to contract.
Into end-of-week earnings & new data may bolster new directional plays.
|
SpotGamma Proprietary Levels |
SPX |
SPY |
NDX |
QQQ |
RUT |
IWM |
|---|---|---|---|---|---|---|
|
Reference Price: |
$4582 |
$456 |
$15750 |
$383 |
$1981 |
$196 |
|
SpotGamma Implied 1-Day Move: |
0.77% |
0.77% |
|
|
|
|
|
SpotGamma Implied 5-Day Move: |
2.12% |
|
|
|
|
|
|
SpotGamma Volatility Trigger™: |
$4570 |
$456 |
$15325 |
$381 |
$1950 |
$196 |
|
Absolute Gamma Strike: |
$4600 |
$455 |
$15475 |
$380 |
$1970 |
$195 |
|
SpotGamma Call Wall: |
$4600 |
$460 |
$15475 |
$385 |
$1970 |
$200 |
|
SpotGamma Put Wall: |
$4500 |
$450 |
$15000 |
$375 |
$1800 |
$185 |
|
Additional Key Levels |
SPX |
SPY |
NDX |
QQQ |
RUT |
IWM |
|---|---|---|---|---|---|---|
|
Zero Gamma Level: |
$4521 |
$456 |
$14571 |
$383 |
$1976 |
$196 |
|
Gamma Tilt: |
1.318 |
0.945 |
2.088 |
1.03 |
0.949 |
0.916 |
|
SpotGamma Gamma Index™: |
1.537 |
-0.054 |
0.077 |
0.010 |
-0.003 |
-0.011 |
|
Gamma Notional (MM): |
$587.348M |
‑$223.316M |
$8.604M |
$76.002M |
‑$2.065M |
‑$74.86M |
|
25 Day Risk Reversal: |
-0.036 |
-0.027 |
-0.034 |
-0.028 |
-0.022 |
-0.024 |
|
Call Volume: |
508.757K |
1.768M |
10.819K |
783.097K |
12.541K |
241.825K |
|
Put Volume: |
834.327K |
2.767M |
13.911K |
1.475M |
18.037K |
403.055K |
|
Call Open Interest: |
5.891M |
6.509M |
56.052K |
4.301M |
189.861K |
3.397M |
|
Put Open Interest: |
12.572M |
13.512M |
70.145K |
9.088M |
352.533K |
6.87M |
|
Key Support & Resistance Strikes |
|---|
|
SPX Levels: [4600, 4575, 4550, 4500] |
|
SPY Levels: [460, 456, 455, 450] |
|
NDX Levels: [16500, 16000, 15475, 15000] |
|
QQQ Levels: [385, 382, 380, 375] |
|
SPX Combos: [(4802,96.80), (4752,95.03), (4724,81.00), (4701,99.00), (4674,92.91), (4669,80.92), (4665,96.03), (4660,77.47), (4651,99.44), (4642,85.65), (4633,85.56), (4628,85.35), (4623,97.62), (4619,86.72), (4614,97.74), (4610,94.56), (4605,91.30), (4601,99.81), (4596,90.75), (4591,94.84), (4587,80.00), (4582,81.03), (4573,93.12), (4564,92.59), (4555,81.27), (4541,83.38), (4513,86.18), (4504,75.28), (4500,92.66), (4399,85.37)] |
|
SPY Combos: [463.3, 454.16, 453.24, 473.35] |
|
NDX Combos: [15467, 15814, 15893, 16019] |
|
QQQ Combos: [383.87, 381.96, 378.89, 376.59] |
