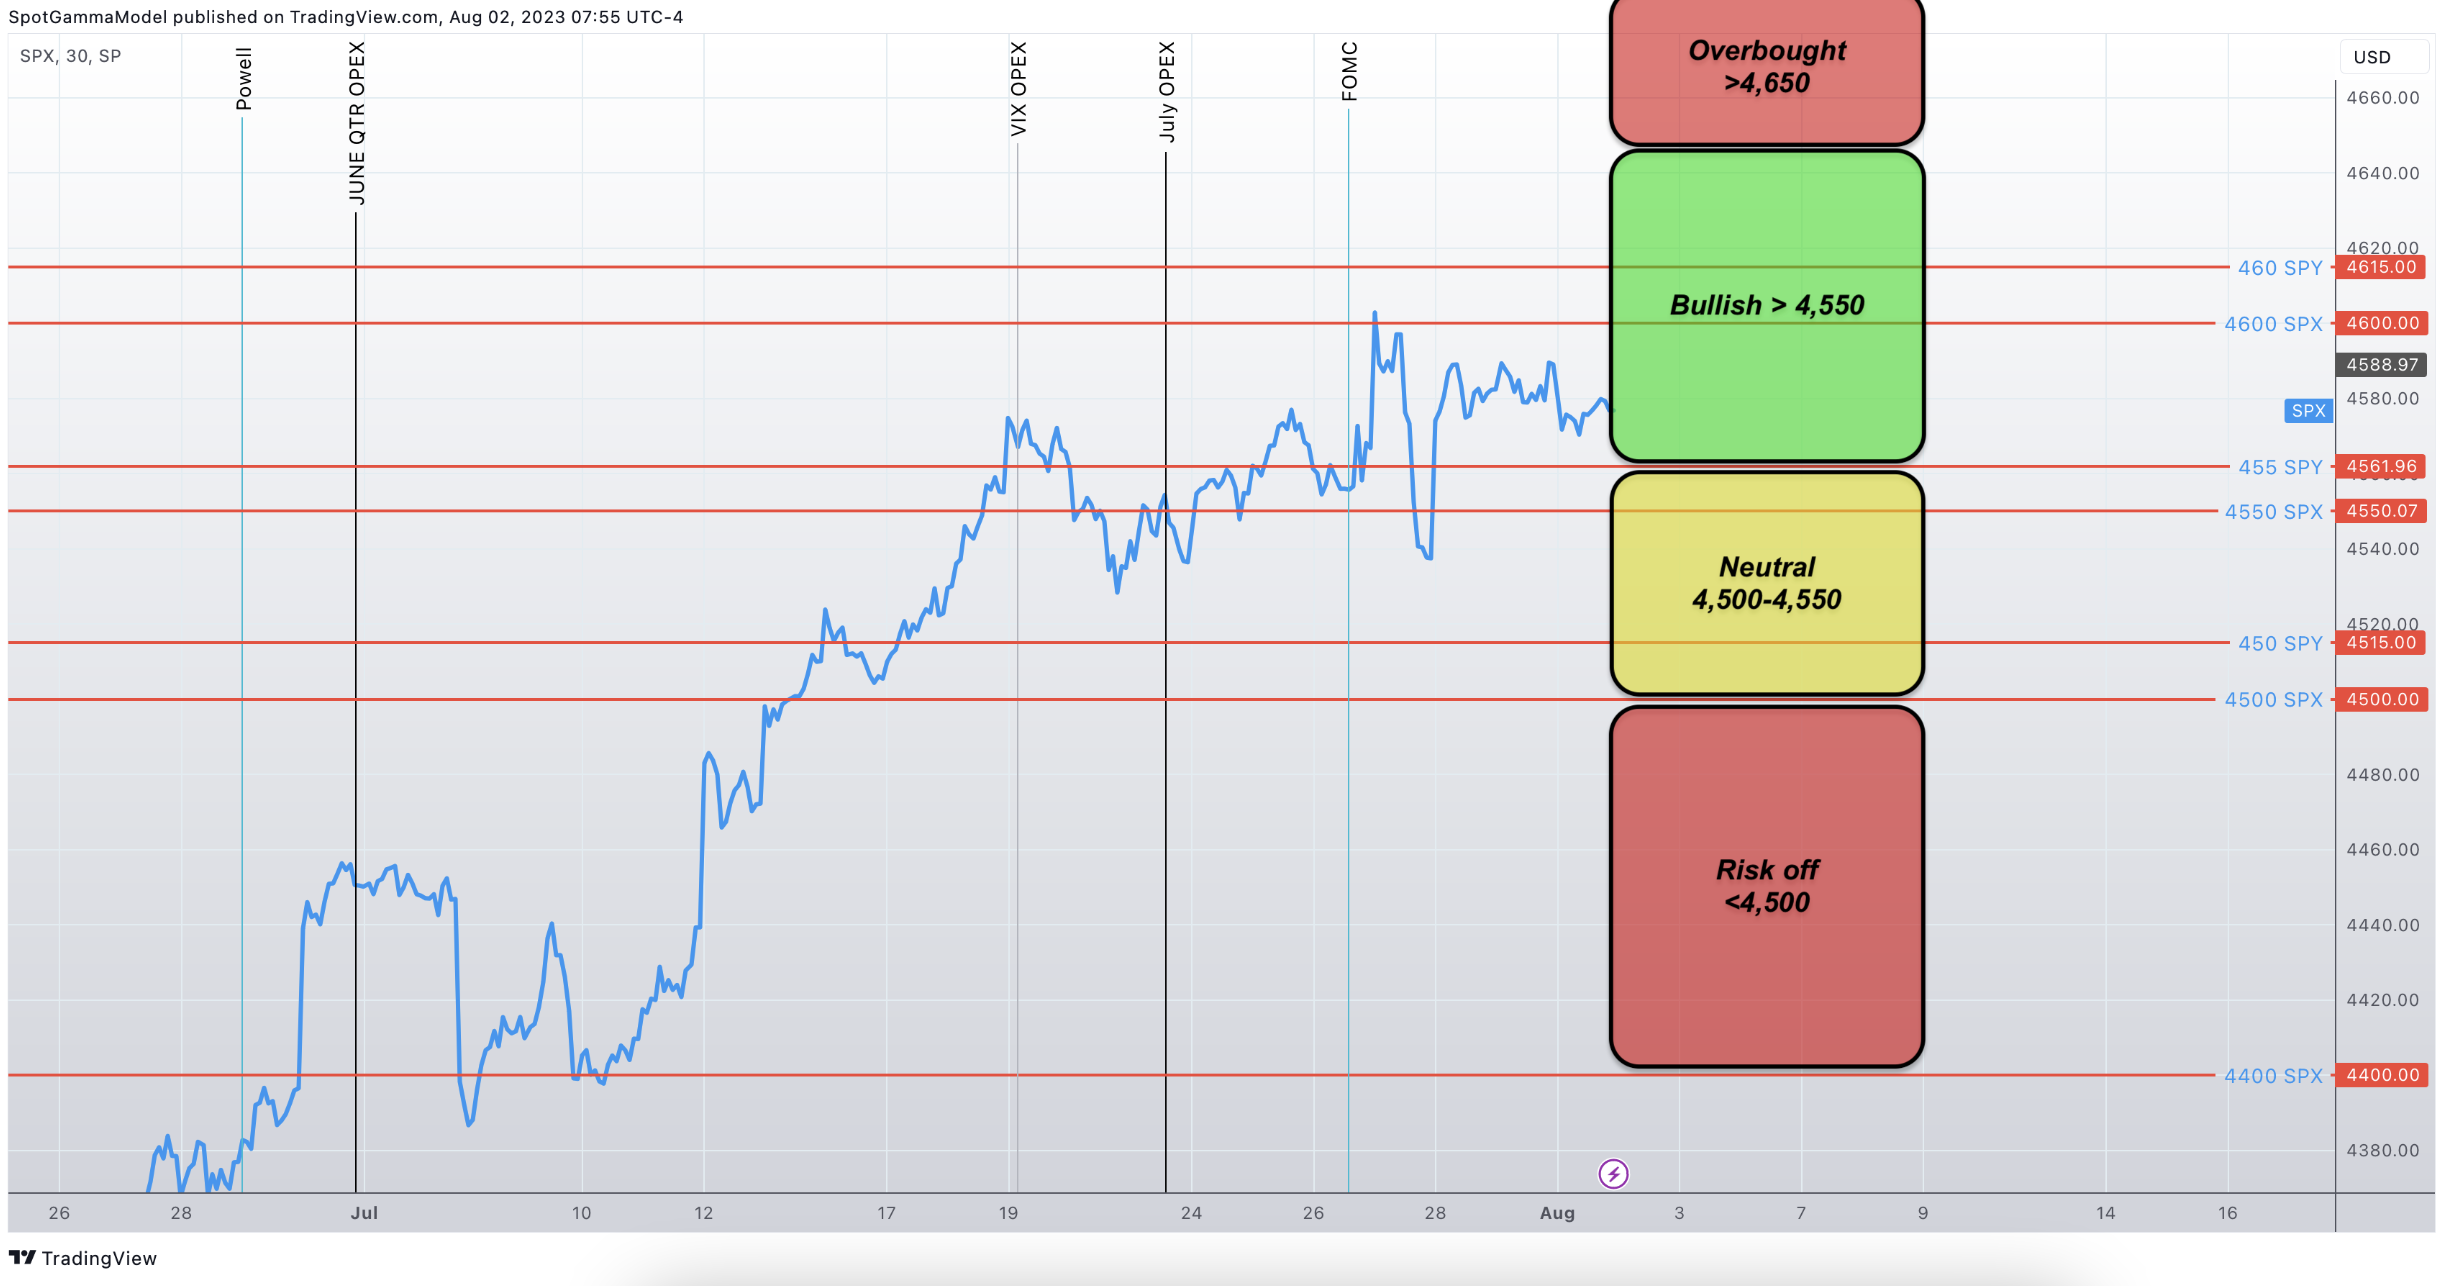
Macro Theme:
Short Term Resistance: 4,600 – 4,615 (SPY 460)
Short Term Support: 4,550
Risk Pivot Level: 4,500 – 4,515 (SPY 450)
Major Range High/Resistance: 4,635 (SPY 462/SPX 4,650 Call Wall(s))
Major Range Low/Support: 4,500
‣ The bullish case remains intact with SPX >=4,550 and we hold a current upside target of major 4,600 resistance*
‣ As realized volatility(RV) shifts lower, it suggests implied volatility should grind down, too. With RV at 9, VIX in the 12’s is reasonable*
‣ Risk shifts higher on a break of 4,500, wherein we would look for a test of 4,400 with a VIX shift towards 20*
*updated 8/2
Founder’s Note:
ES futures are down 50bps to 4,580 after a surprise US ratings downgrade from Fitch. Key SG levels are unchanged, with support today at 4,565 (SPY 455) – 4,550. Major resistance above is at 4,600. A break of 4,550 likely implies a test of 4,500.
QQQ resistance is at 380/381, with support at 375. The
Call Wall,
and the top of our QQQ range, remains at 385.
Currently equities have the benefit of positive gamma and low realized volatility. These forces support equities via mean reversion (buy the dip, sell the rip= gamma) while invoking a positive equity drift (vol decay = vanna). The strength of these forces increase as equities move higher – larger positive gamma brings stronger & faster mean reversion which limits market movement. That pressures realized volatility lower, which drags down implied vol. This scenario is the one we’ve been operating from, and continue to do so while the SPX is >4,550.
As the market shifts lower, those positive gamma flows begin to weaken, which allows for ranges to gradually widen. We view this as the 4,500-4,550 area, wherein on a break of 4,550 we’d anticipate a quick test of 4,500. However, because there is a large options position at 4,500 there is likely a buyers response which creates initial support. In this band we believe traders should start to consider downside hedges, particularly when implied volatility is relatively low.
The final zone comes with the onset of negative gamma, which infers liquidity providers begin shorting into weaker markets. This serves to widen trading ranges, which drives volatility higher. This, we believe, starts on a break of 4,500 which would lead to a test of 4,400.
Visually, this is depicted through our vanna model, below. You can see that under 4,500 the standard delta model (grey) depicts an increase in delta notional (Y axis) as the S&P slides lower. This positive delta is driven from liquidity providers being net short puts, and as the market goes lower those puts increase in value. To hedge this risk one may have to sell futures incrementally as the market declines.
Along with this market decline, implied volatility likely shifts higher. The impact of this is estimated through the IV-adjusted delta (purple), which highlights how the downside delta exposure jumps when lower S&P prices meet higher IV’s.
Below is a price map of the view outlined above:
|
SpotGamma Proprietary Levels |
SPX |
SPY |
NDX |
QQQ |
RUT |
IWM |
|---|---|---|---|---|---|---|
|
Reference Price: |
$4576 |
$456 |
$15718 |
$382 |
$1994 |
$197 |
|
SpotGamma Implied 1-Day Move: |
0.80% |
0.80% |
|
|
|
|
|
SpotGamma Implied 5-Day Move: |
2.12% |
|
|
|
|
|
|
SpotGamma Volatility Trigger™: |
$4570 |
$456 |
$15420 |
$381 |
$1940 |
$196 |
|
Absolute Gamma Strike: |
$4600 |
$455 |
$15475 |
$380 |
$1970 |
$195 |
|
SpotGamma Call Wall: |
$4650 |
$462 |
$15475 |
$385 |
$1970 |
$200 |
|
SpotGamma Put Wall: |
$4500 |
$450 |
$15000 |
$375 |
$1800 |
$190 |
|
Additional Key Levels |
SPX |
SPY |
NDX |
QQQ |
RUT |
IWM |
|---|---|---|---|---|---|---|
|
Zero Gamma Level: |
$4550 |
$455 |
$14651 |
$385 |
$1989 |
$197 |
|
Gamma Tilt: |
1.151 |
0.917 |
2.041 |
0.908 |
0.987 |
0.955 |
|
SpotGamma Gamma Index™: |
0.792 |
-0.089 |
0.078 |
-0.035 |
-0.001 |
-0.006 |
|
Gamma Notional (MM): |
$373.957M |
‑$321.782M |
$8.99M |
‑$181.493M |
‑$56.688K |
‑$45.094M |
|
25 Day Risk Reversal: |
-0.037 |
-0.027 |
-0.031 |
-0.028 |
-0.03 |
-0.028 |
|
Call Volume: |
417.82K |
1.291M |
4.759K |
642.19K |
13.414K |
338.174K |
|
Put Volume: |
712.602K |
1.817M |
9.177K |
816.582K |
25.078K |
535.624K |
|
Call Open Interest: |
6.005M |
6.706M |
57.719K |
4.353M |
193.005K |
3.538M |
|
Put Open Interest: |
12.622M |
14.139M |
72.902K |
9.383M |
361.997K |
7.114M |
|
Key Support & Resistance Strikes |
|---|
|
SPX Levels: [4600, 4550, 4500, 4400] |
|
SPY Levels: [460, 457, 455, 450] |
|
NDX Levels: [16500, 16000, 15475, 15000] |
|
QQQ Levels: [385, 380, 375, 370] |
|
SPX Combos: [(4801,96.71), (4751,95.23), (4723,83.63), (4700,98.93), (4673,93.42), (4668,81.27), (4664,95.66), (4659,77.27), (4655,76.05), (4650,99.17), (4641,84.66), (4636,74.15), (4632,95.34), (4627,97.73), (4618,81.11), (4613,95.41), (4609,85.47), (4604,78.84), (4600,99.06), (4590,95.48), (4572,81.73), (4563,90.11), (4554,87.48), (4549,89.09), (4540,88.91), (4531,82.55), (4513,84.85), (4504,78.94), (4499,95.20), (4490,79.65), (4449,79.59), (4412,74.06), (4398,89.14)] |
|
SPY Combos: [462.4, 457.38, 467.42, 460.12] |
|
NDX Combos: [15482, 15812, 16017, 15404] |
|
QQQ Combos: [375.91, 383.95, 388.92, 399.26] |
