
Macro Theme:
Short Term Resistance: 4,500 SPX Call Wall
Short Term Support: 4,450
Risk Pivot Level: 4,400
Major Range High/Resistance: 4,500 SPX Call Wall
Major Range Low/Support: 4,400
‣ From 8/29 – 9/8 there are a few data points (jobs, ISM) but, (based on IV’s) they are fairly low risk. Added into this window is the Labor Day holiday (next Monday). Entering into the week of 9/11, there are a litany of catalysts including: CPI, big Sep OPEX, VIX Exp & FOMC. This suggests to us vol may be under pressure another ~2 weeks, and then risks pick up.*
‣ While we have no particular reason to be bearish, we note that a strong rally into OPEX/VIX Exp would certainly clear up the downside “padding” that we’ve been enjoying (and discussing) over the last few weeks. This could make downside into end of September/October “more available”.*
*updated 8/29
**updated 8/16
Founder’s Note:
Futures are flat to 4,505. The
Call Walls
remain at 4,500 for SPX, and have shifted to 450 for SPY. This sets the top of our range at 4,500 – 4,510, and we view a move above this level as overbought. Resistance above this level is at 4,525. Support below is at 4,489 then 4,460 (SPY 445)/4,450. Our daily range expectation has contracted to 71bps.
In QQQ the
Call Wall
is at 385, with the largest gamma strike at 375, which is resistance for today. Support below is at 370.
TLDR: While we are not bearish, we are looking for some mean reversion/pinning here while options positions re-sync to higher equities. 4,500 is our short term high (and remains so until/unless the
Call Wall
rolls higher). We think the downside is well supported, with support today in the 4,450 area.
We received a few comments in regards to the “the quiet period” given yesterdays 1.5% intraday move and our view that volatility should remain low. Our range expectation for yesterday was 77bps, with resistance around 4,450-4,460, and the market jumped above that. Yesterdays JOLTS report was a mutiple-standard-deviation print, and when something like that so far exceeds expectations it will often lead to higher volatility. We fully expect volatility to snap back in line with our expectations, unless other data prints this week exhibit similar aberrations (GDP today at 8:30, PCE tomorrow).
Our point here is that traders seem to be extrapolating yesterdays move into the dawning of a new bull market which adds +1% a day, but we think things are unlikely to continue at that yesterday’s pace.
On this point, yesterdays ramp brought out the short term put sellers, with a bit of call buying. This does keep standard gamma measurements more positive than some may suggest (short puts add positive dealer gamma). You can see these changes via our fixed strike dashboard, below. While this is currently in beta, we have posted it here as it so very well depicts the positioning change from Monday to today. The shades of green indicate that implied volatility for a given strike, on a given expiration went higher over the last two days. Red informs us that implied volatility for that strike declined.
Clearly the short term downside was crushed/sold yesterday, as shown below in red, particularly into and around short dated expirations (before our catalyts window opening on 9/10). To the upside, there is a mild green – suggesting a light bid to calls. The upside bid appears somewhat stronger in QQQ, however we didn’t see a signal of massive index longs. Further, the fact that our
Call Wall
remains unchanged in SPX works against the idea of another jumpy upside day.

On this point of IV crush – this was one of our prime factors for having an upside target into this week.
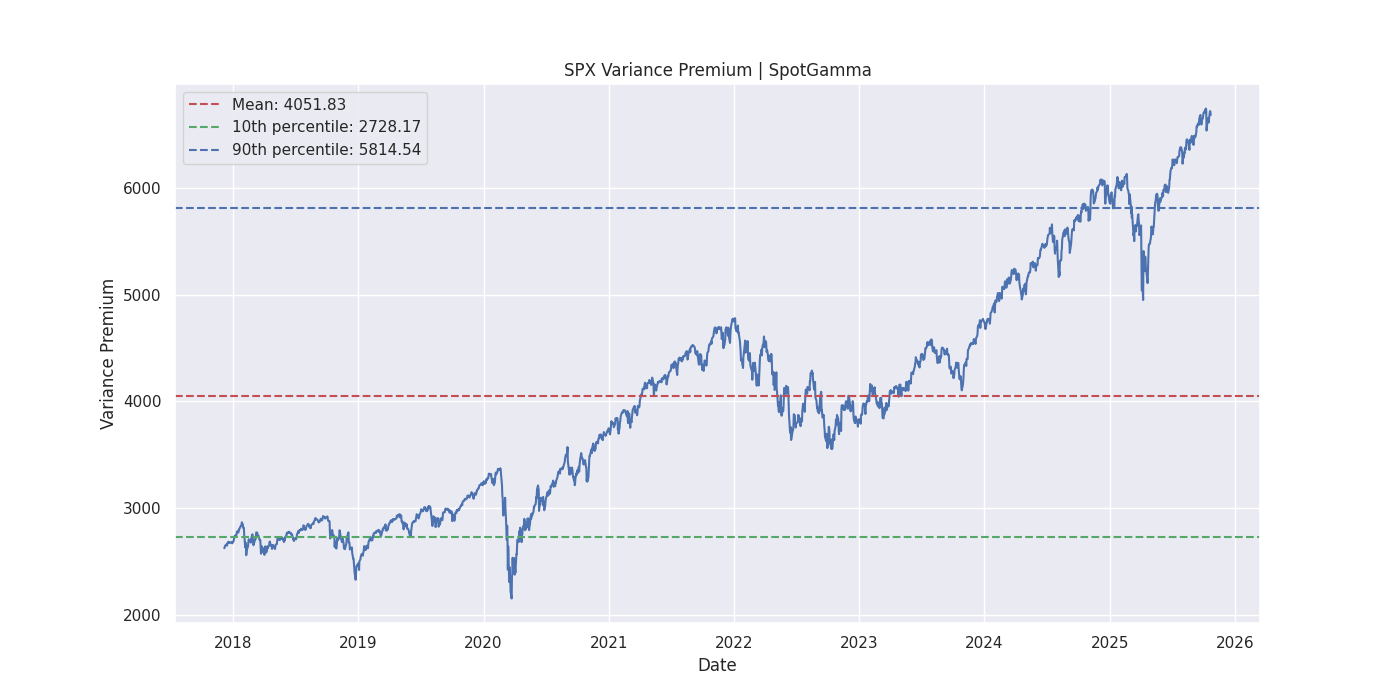
Based on this we received several “how much vanna fuel/IV crush is left?” inquiries, and the answer is “not a lot”. This can be seen in the plot below, which shows the spread between 1 month SPX realized volatility, and the VIX. As you can see this metric is now working back toward the green dotten line, which suggests there is now a lower volatility (variance) premium. In other words, the big volatility padding has drained off. Now, if realied vol goes lower (as is our expecation over the next 1-2 weeks), then VIX/IV has more downside – but this is a “grind/drift” as opposed to the “plunge” we saw yesterday.
Additionally, here is our vanna model which shows us that any further decline in IV’s may lead to heavier upside market resistance. This is because our model suggests that dealer exposure increases with declines in implied volatility, which suggests dealers need to short more futures into higher markets/lower IV. This is seen through the purple, IV-adjusted delta, vs the standard delta model (grey). If the purple line was lower than the grey line, it means dealer delta exposure decreases into higher markets, which means they need to cover short hedges (thus fueling the market higher).
This supports the idea of slower markets/less volatility going forward.

| SpotGamma Proprietary Levels | SPX | SPY | NDX | QQQ | RUT | IWM |
|---|---|---|---|---|---|---|
| Reference Price: | $4497 | $449 | $15380 | $374 | $1895 | $188 |
| SpotGamma Implied 1-Day Move: | 0.71% | 0.71% |
|
|
|
|
| SpotGamma Implied 5-Day Move: | 2.10% |
|
|
|
|
|
| SpotGamma Volatility Trigger™: | $4435 | $448 | $14620 | $368 | $1850 | $187 |
| Absolute Gamma Strike: | $4500 | $450 | $15000 | $370 | $1900 | $185 |
| SpotGamma Call Wall: | $4500 | $450 | $14625 | $385 | $1860 | $192 |
| SpotGamma Put Wall: | $4300 | $440 | $15250 | $350 | $1750 | $185 |
| Additional Key Levels | SPX | SPY | NDX | QQQ | RUT | IWM |
|---|---|---|---|---|---|---|
| Zero Gamma Level: | $4438 | $448 | $14228 | $374 | $1919 | $193 |
| Gamma Tilt: | 1.204 | 0.904 | 1.378 | 1.022 | 0.818 | 0.568 |
| SpotGamma Gamma Index™: | 1.287 | -0.104 | 0.038 | 0.009 | -0.018 | -0.094 |
| Gamma Notional (MM): | $356.10M | ‑$515.28M | $5.264M | ‑$6.581M | ‑$15.757M | ‑$943.287M |
| 25 Day Risk Reversal: | -0.041 | -0.041 | -0.033 | -0.034 | -0.029 | -0.041 |
| Call Volume: | 682.089K | 2.009M | 21.633K | 1.087M | 14.729K | 280.952K |
| Put Volume: | 1.033M | 3.705M | 20.90K | 1.498M | 25.212K | 536.386K |
| Call Open Interest: | 6.39M | 6.758M | 61.299K | 4.937M | 223.919K | 3.569M |
| Put Open Interest: | 13.027M | 14.901M | 81.003K | 9.932M | 407.377K | 7.567M |
| Key Support & Resistance Strikes |
|---|
| SPX Levels: [4550, 4500, 4450, 4400] |
| SPY Levels: [450, 448, 445, 440] |
| NDX Levels: [16000, 15500, 15000, 14625] |
| QQQ Levels: [375, 372, 370, 360] |
| SPX Combos: [(4700,94.80), (4673,78.94), (4664,90.17), (4651,94.22), (4624,84.46), (4606,80.68), (4601,97.85), (4579,79.59), (4574,90.79), (4565,76.03), (4556,90.02), (4552,97.77), (4547,82.89), (4538,94.42), (4534,78.94), (4529,88.67), (4525,98.64), (4520,91.62), (4516,89.46), (4511,92.38), (4507,92.89), (4502,98.57), (4489,90.69), (4484,80.68), (4480,85.99), (4475,85.89), (4408,79.32), (4399,90.38), (4376,83.30), (4358,77.28), (4349,88.25), (4327,85.13), (4304,85.43), (4300,96.14)] |
| SPY Combos: [455.88, 435.67, 445.55, 466.21] |
| NDX Combos: [15795, 14780, 14627, 15595] |
| QQQ Combos: [364.27, 368.01, 357.52, 362.77] |
SPX Gamma Model
View All Indices Charts
0 comentarios