Macro Theme:
Short Term SPX Resistance: 4,587
Short Term SPX Support: 4,550
SPX Risk Pivot Level: 4,500
Major SPX Range High/Resistance: 4,600
Major SPX Range Low/Support: 4,200
‣ IV levels are anemic (~8%), which suggests that a pop higher in IV/equity downside is due. A break of 4,500 is our “risk off” level.*
‣ 4,600 is our current max upside target, as call positions are not yet building above that level.*
‣ We recommend expressing longs in RUT/IWM or Mag 7 vs SPX/SPY into year end, due to upside options positioning.*
*updated 11/22
Founder’s Note:
ES Futures are 20pts higher to at 4,580. Key SG levels for the SPX are:
- Support: 4,250, 4,525, & 4,500
- Resistance: 4,573, 4,587, 4,600, 4,623
- 1 Day Implied Range: 0.67%
In QQQ resistance is at 395, then the 400
Call Wall.
Support is at 389, then 386.
Traders will be watching 8:30AM ET GDP.
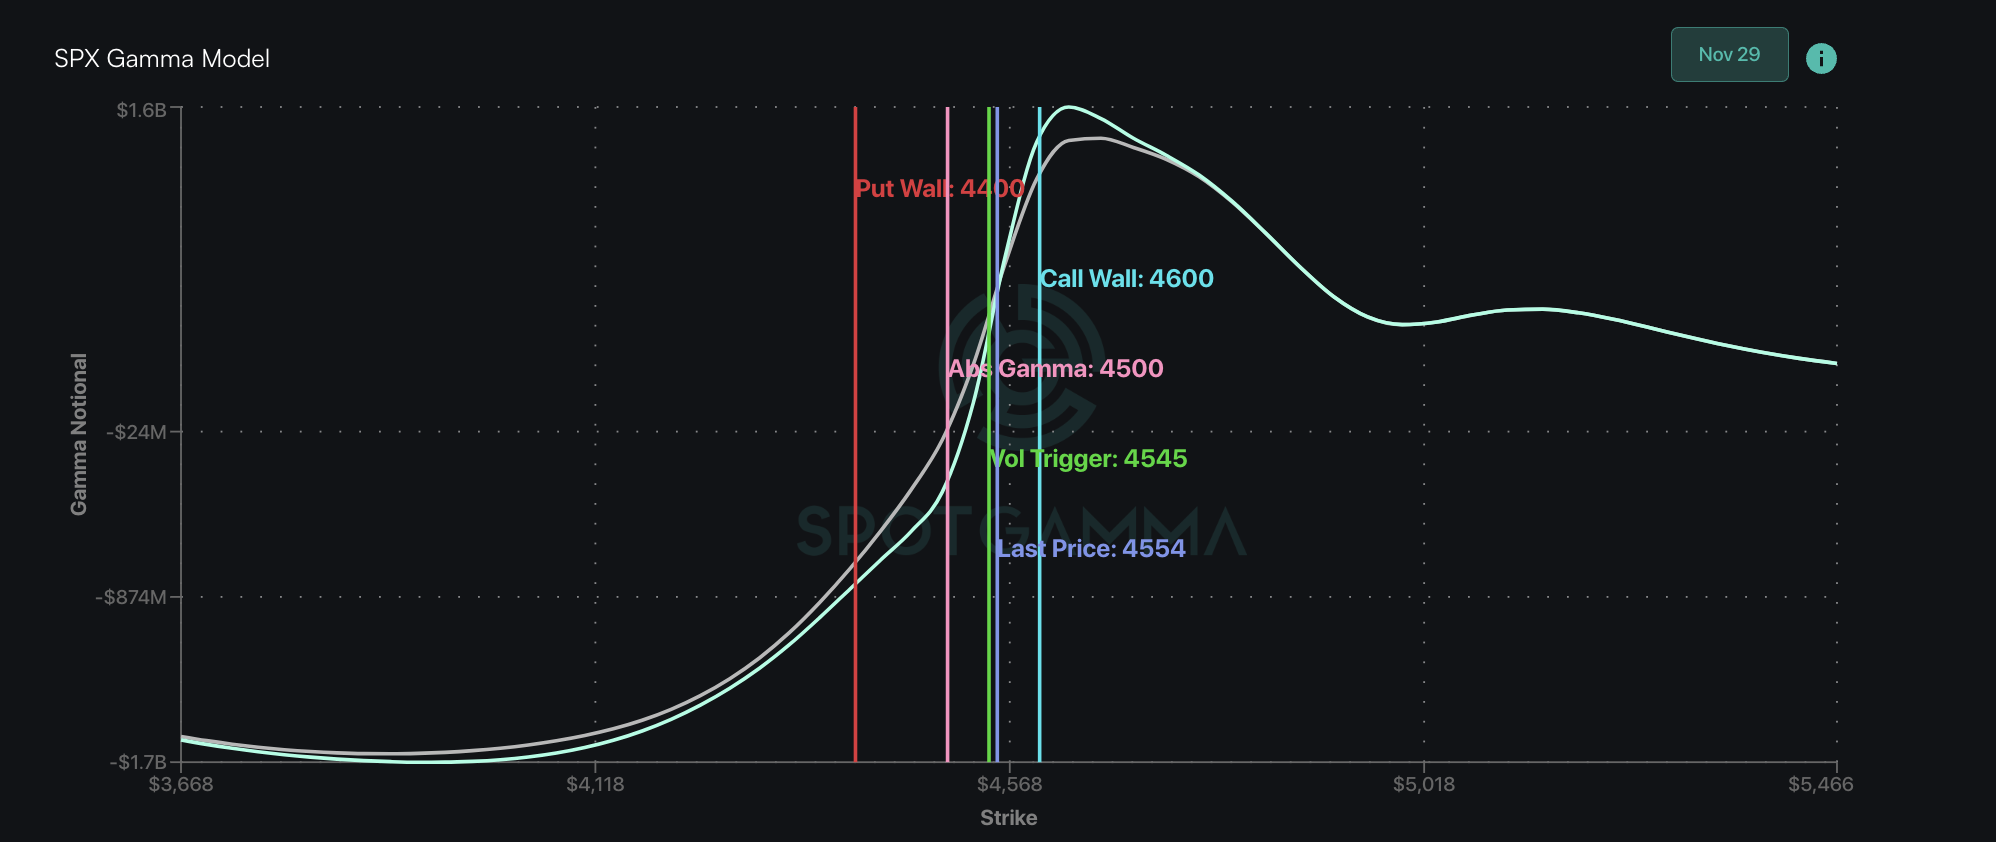
With futures shifting higher, the S&P500 is approaching “peak gamma”. This can be seen in the chart below, wherein the top of our gamma curve peaks out just above 4,600. This is important because daily ranges should remain very tight up into the 4,600
Call Wall/
peak gamma area, which is reflected by our daily range being at a tight 0.67%. For traders, this means the SPX should continue to exhibit strong intraday mean reversion (sell rips, buy dips).
While our belief is that the market is overall due for a correction/consolidation, it seems we’re now at the point in the cycle wherein bullish bets are turning to rampant speculation in the lower quality names. This often happens when traders believe market risks have been removed, and focus can shift to what laggards may need to “catch up” to the rally seen in higher quality names (i.e. Mag 7). With this, speculators attack vector shifts to leveraged bets (i.e. short dated call buying) on things like the classic meme stocks.
Consider TSLA, which, while its certainly not “the lowest quality” of names, it has definitely been the worst performing of the Magnificent 7. TSLA played some serious catch up yesterday, wherein there was +$500mm of positive deltas (purple line, driven mainly by call buying) – its largest positive delta day in the last 30 (
HIRO
gauge in the bottom right box). The result was a +5% move higher into its $250
Call Wall.
Next we turn to the ultimate meme – GME. The stock was up 13% yesterday ahead of its Dec 6th earnings.
Call Volume
was 143k, which was its largest since Jun ’23.
This long call demand jacked-up call skew for short dated expirations, as shown here with 12/15 skew for yesterday (gray) vs the previous day (green):
If you have intraday or very short time frames you can often catch fast moves higher in these speculative names by looking for stocks that have strong positive
HIRO
signals, that are trading below their
Call Wall
strikes. However, for those of you with slightly longer time frames, there is risk in holding these names with increasing call skews (like GME above), as it may signal a short term, blow-off top.
You can filter for names that may qualify for stocks under “heavy speculation” by sorting “SKEW” or “NE SKEW” (NE = next expiration). Numbers with a positive skew reflect call IV’s which are > relative put IV’s. We also look for heavy “Next Expiry Volume” (first 2 columns) that are >=40%.
|
SpotGamma Proprietary Levels |
SPX |
SPY |
NDX |
QQQ |
RUT |
IWM |
|---|---|---|---|---|---|---|
|
Reference Price: |
$4554 |
$454 |
$16010 |
$390 |
$1792 |
$178 |
|
SpotGamma Implied 1-Day Move: |
0.67% |
0.67% |
|
|
|
|
|
SpotGamma Implied 5-Day Move: |
2.09% |
|
|
|
|
|
|
SpotGamma Volatility Trigger™: |
$4545 |
$454 |
$15260 |
$389 |
$1770 |
$177 |
|
Absolute Gamma Strike: |
$4500 |
$455 |
$15825 |
$390 |
$1800 |
$180 |
|
SpotGamma Call Wall: |
$4600 |
$460 |
$15825 |
$400 |
$1800 |
$185 |
|
SpotGamma Put Wall: |
$4400 |
$452 |
$14000 |
$360 |
$1700 |
$170 |
|
Additional Key Levels |
SPX |
SPY |
NDX |
QQQ |
RUT |
IWM |
|---|---|---|---|---|---|---|
|
Zero Gamma Level: |
$4494 |
$454 |
$14923 |
$386 |
$1788 |
$176 |
|
Gamma Tilt: |
1.268 |
0.979 |
2.31 |
1.143 |
1.001 |
1.122 |
|
SpotGamma Gamma Index™: |
1.679 |
-0.021 |
0.117 |
0.052 |
0.000 |
0.021 |
|
Gamma Notional (MM): |
$704.715M |
‑$154.908M |
$13.808M |
$246.102M |
$1.748M |
$318.797M |
|
25 Day Risk Reversal: |
-0.028 |
-0.029 |
-0.019 |
-0.021 |
-0.011 |
-0.022 |
|
Call Volume: |
517.305K |
1.477M |
8.042K |
682.386K |
26.047K |
549.226K |
|
Put Volume: |
916.149K |
2.061M |
9.044K |
1.087M |
20.156K |
365.361K |
|
Call Open Interest: |
7.214M |
7.103M |
59.397K |
4.418M |
287.802K |
5.332M |
|
Put Open Interest: |
13.357M |
13.479M |
67.84K |
8.064M |
449.399K |
7.689M |
|
Key Support & Resistance Strikes |
|---|
|
SPX Levels: [4600, 4550, 4500, 4400] |
|
SPY Levels: [460, 455, 454, 450] |
|
NDX Levels: [16000, 15825, 15500, 15000] |
|
QQQ Levels: [390, 389, 385, 380] |
|
SPX Combos: [(4774,78.25), (4751,94.93), (4723,78.91), (4705,80.13), (4701,98.03), (4673,88.67), (4655,76.31), (4651,97.22), (4641,78.83), (4628,86.84), (4623,97.76), (4619,77.96), (4614,73.20), (4610,92.41), (4605,96.79), (4600,99.86), (4596,86.77), (4591,93.43), (4587,94.91), (4582,92.05), (4578,74.21), (4573,99.15), (4569,97.47), (4564,90.65), (4559,90.35), (4555,88.11), (4550,94.96), (4546,91.77), (4541,87.08), (4537,93.30), (4532,79.76), (4528,81.67), (4518,82.16), (4514,96.14), (4505,83.89), (4500,82.01), (4496,77.41), (4400,95.41), (4350,84.79)] |
|
SPY Combos: [459.51, 456.78, 469.51, 461.78] |
|
NDX Combos: [15818, 16411, 16203, 16123] |
|
QQQ Combos: [386.11, 400.53, 395.46, 390.4] |
