Macro Theme:
Short Term SPX Resistance: 5,000
Short Term SPX Support: 4,900
SPX Risk Pivot Level: 4,900
Major SPX Range High/Resistance: 5,000
Major SPX Range Low/Support: 4,800
‣ We look for a sharp directional move post-FOMC & into 2/16 expiration, with 5,000 the key upside strike. Major downside “risk-off” occurs on a break of 4,800, which is our first major support.*
*updated 2/1
Founder’s Note:
ES Futures are down fractionally to 4,971. NQ futures are flat at 17,718.
Key SG levels for the SPX are:
- Support: 4,930, 4,900
- Resistance: 4,969, 4,973, 5,000
- 1 Day Implied Range: 0.62%
For QQQ:
- Support: 423, 420
- Resistance: 430, 440
Call Wall
IWM:
- Support: 190
- Resistance: 195, 200
Call Wall
The weekend is likely to have stalled some momentum from Friday’s heavy bid, and we think the 4,950 to 5,000 area will start to present sticky upside. 5,000 in particular is unlikely to be a strike that is just bid-on-through due to large positions forming at that strike. For today, we see the SPY 4,930 area as support, with 4,900 being longer term support.
We start with fixed strike volatility matrix showing shades of green for higher strikes, as shown in the white box, below. This implies that traders bid up the price of SPX calls into the Friday’s strength, which is not all that surprising given the +1% SPX rally. This green area, in our view, is likely to start turning to shades of red as traders overwrite/sell upside calls.
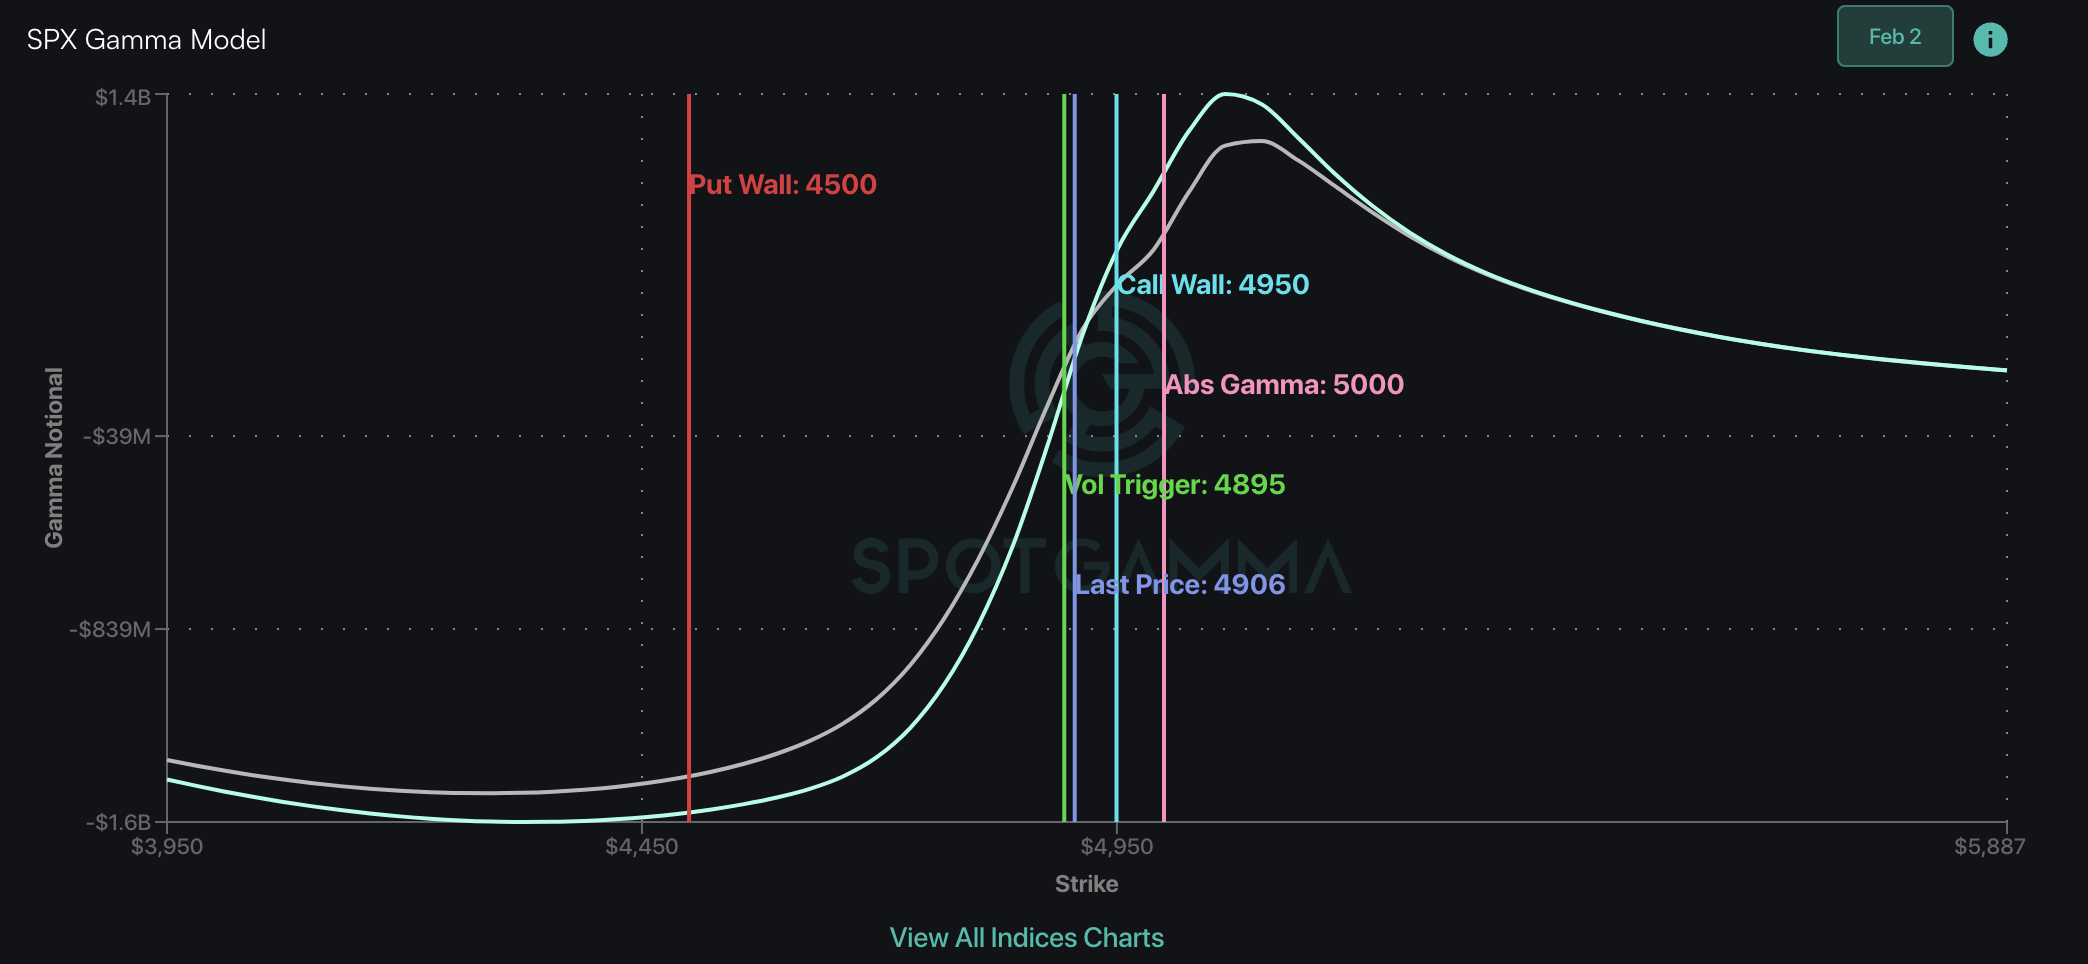
Shown here is that large amount of gamma building up at the SPY 495 & SPX 5,000 – SPY 500 (~SPX 5,015 equivalent); much of this is for Feb OPEX. Further, our SG 1-day implied move is tightening, at 62bps today. This would sync up with a view of traders now turning to sell upside SPX calls.
This further indicates that traders looking to play upside should focus on QQQ and/or single stocks which don’t have this upside resistance band.
On this topic of the 1-day implied move, we wanted to provide some recent stats.
The 1 day implied move is used to estimate the max open to close range of the next SPX session. We strike the range at the SPX opening price, and use the implied move as an upper or lower bound for the end of day closing level. The idea here is that this model will start to signal shifts in dealer gamma which forecast higher or lower volatility. The range of the model is 50bps to 150bps.
For example, if the SPX opens at 4,900 with an implied move of 100bps (1%), then the open to close range is 4,850 to 4,950.
Since March of ’23, we found that the SG-1 Day Implied move was accurate in 75% of sessions, meaning the SPX closing within the estimated open to close range.
However, the SPX moved outside of that range on 55% of sessions, suggesting that the market does indeed often move outside of our estimated boundaries, and then move back inside of those boundaries. This backs the idea of using the 1-day implied move as an intraday overbought/oversold indicator.
On sessions where the 1-day implied move is broken, the average move is 27bps (median 20bps).
Some other stats:
- Average high/low range of the SPX over this period: 91bps
- Average open/close range of the SPX over this period: 50bps
- Average SG Implied move over this period: 82bps
|
SpotGamma Proprietary Levels |
SPX |
SPY |
NDX |
QQQ |
RUT |
IWM |
|---|---|---|---|---|---|---|
|
Reference Price: |
$4958 |
$494 |
$17642 |
$429 |
$1962 |
$194 |
|
SpotGamma Implied 1-Day Move: |
0.62% |
0.62% |
|
|
|
|
|
SpotGamma Implied 5-Day Move: |
1.86% |
|
|
|
|
|
|
SpotGamma Volatility Trigger™: |
$4930 |
$492 |
$16900 |
$423 |
$1915 |
$195 |
|
Absolute Gamma Strike: |
$5000 |
$495 |
$17100 |
$430 |
$2000 |
$190 |
|
SpotGamma Call Wall: |
$5000 |
$495 |
$17100 |
$440 |
$1920 |
$200 |
|
SpotGamma Put Wall: |
$4930 |
$470 |
$16000 |
$400 |
$1800 |
$187 |
|
Additional Key Levels |
SPX |
SPY |
NDX |
QQQ |
RUT |
IWM |
|---|---|---|---|---|---|---|
|
Zero Gamma Level: |
$4893 |
$489 |
$16322 |
$425 |
$1973 |
$197 |
|
Gamma Tilt: |
1.229 |
1.185 |
1.988 |
1.109 |
0.910 |
0.727 |
|
SpotGamma Gamma Index™: |
1.321 |
0.168 |
0.092 |
0.042 |
-0.008 |
-0.056 |
|
Gamma Notional (MM): |
$577.208M |
$769.561M |
$9.926M |
$223.656M |
‑$6.244M |
‑$522.302M |
|
25 Delta Risk Reversal: |
-0.032 |
-0.018 |
-0.028 |
-0.021 |
-0.022 |
-0.012 |
|
Call Volume: |
660.411K |
2.823M |
9.551K |
1.034M |
16.962K |
652.436K |
|
Put Volume: |
1.326M |
3.661M |
8.749K |
1.24M |
24.502K |
565.913K |
|
Call Open Interest: |
6.385M |
6.38M |
52.495K |
3.932M |
243.301K |
4.328M |
|
Put Open Interest: |
12.762M |
14.455M |
66.27K |
7.663M |
432.073K |
7.904M |
|
Key Support & Resistance Strikes |
|---|
|
SPX Levels: [5000, 4900, 4800, 4950] |
|
SPY Levels: [495, 490, 494, 500] |
|
NDX Levels: [17100, 17600, 17000, 17625] |
|
QQQ Levels: [430, 425, 424, 415] |
|
SPX Combos: [(5202,96.67), (5152,92.65), (5127,76.76), (5117,81.10), (5102,98.89), (5073,88.46), (5068,79.26), (5058,75.10), (5048,97.61), (5038,84.32), (5028,74.87), (5023,94.46), (5018,92.54), (5013,94.18), (5008,84.43), (4998,99.90), (4988,91.17), (4978,94.25), (4973,96.28), (4969,96.85), (4959,84.45), (4949,98.75), (4929,96.57), (4924,93.74), (4899,95.01), (4800,71.79), (4775,77.39), (4750,74.18)] |
|
SPY Combos: [500.32, 505.28, 515.69, 502.8] |
|
NDX Combos: [18084, 17096, 17837, 17678] |
|
QQQ Combos: [428.02, 423.72, 424.58, 422.86] |
SPX Gamma Model
Strike: $5,315
- Next Expiration: $559,507,156
- Current: $563,279,946
View All Indices Charts
