
Macro Theme:
Short Term SPX Resistance: 5,015 (SPY 500)
Short Term SPX Support: 4,9700 (SPY 495)
SPX Risk Pivot Level: 4,900
Major SPX Range High/Resistance: 5,000
Major SPX Range Low/Support: 4,800
‣ Volatility should continue to contract into 2/14 VIX expiration – 2/16 equity expiration. Major downside “risk-off” occurs on a break of 4,900, which is our first major support. 5,000 is major resistance.*
*updated 2/7
Founder’s Note:
ES Futures are up fractionally to 5,020. NQ futures are up 25 bps to 17,913.
Key SG levels for the SPX are:
- Support: 4,968, 4,950
- Resistance: 5,000, 5015, 5,023, 5050
- 1 Day Implied Range: 0.68%
For QQQ:
- Support: 432, 430
- Resistance: 440
Call Wall
IWM:
- Support: 195, 190
- Resistance: 200
Call Wall
The SPX
Call Wall
has shifted higher, to 5,050. This is now the top of our trading range, and a move above 5,000 is no longer considered overbought. The SPY
Call Wall
remains at 500 (SPX 5,015), which is the largest S&P500 gamma level (i.e. bigger than any SPX strike, too).
For today we anticipate another tight trading range, with weekend volatility sellers stepping in to collect that minimal theta. There is also very little data scheduled to release today.
While the SPX
Call Wall
did flip higher, we still watch 5,000 – 5,015 as fair value, or the “base of operations”, as it remains the largest gamma area on the board. This implies that there should be strong mean reversion into this region, not just on the day, but into next week.
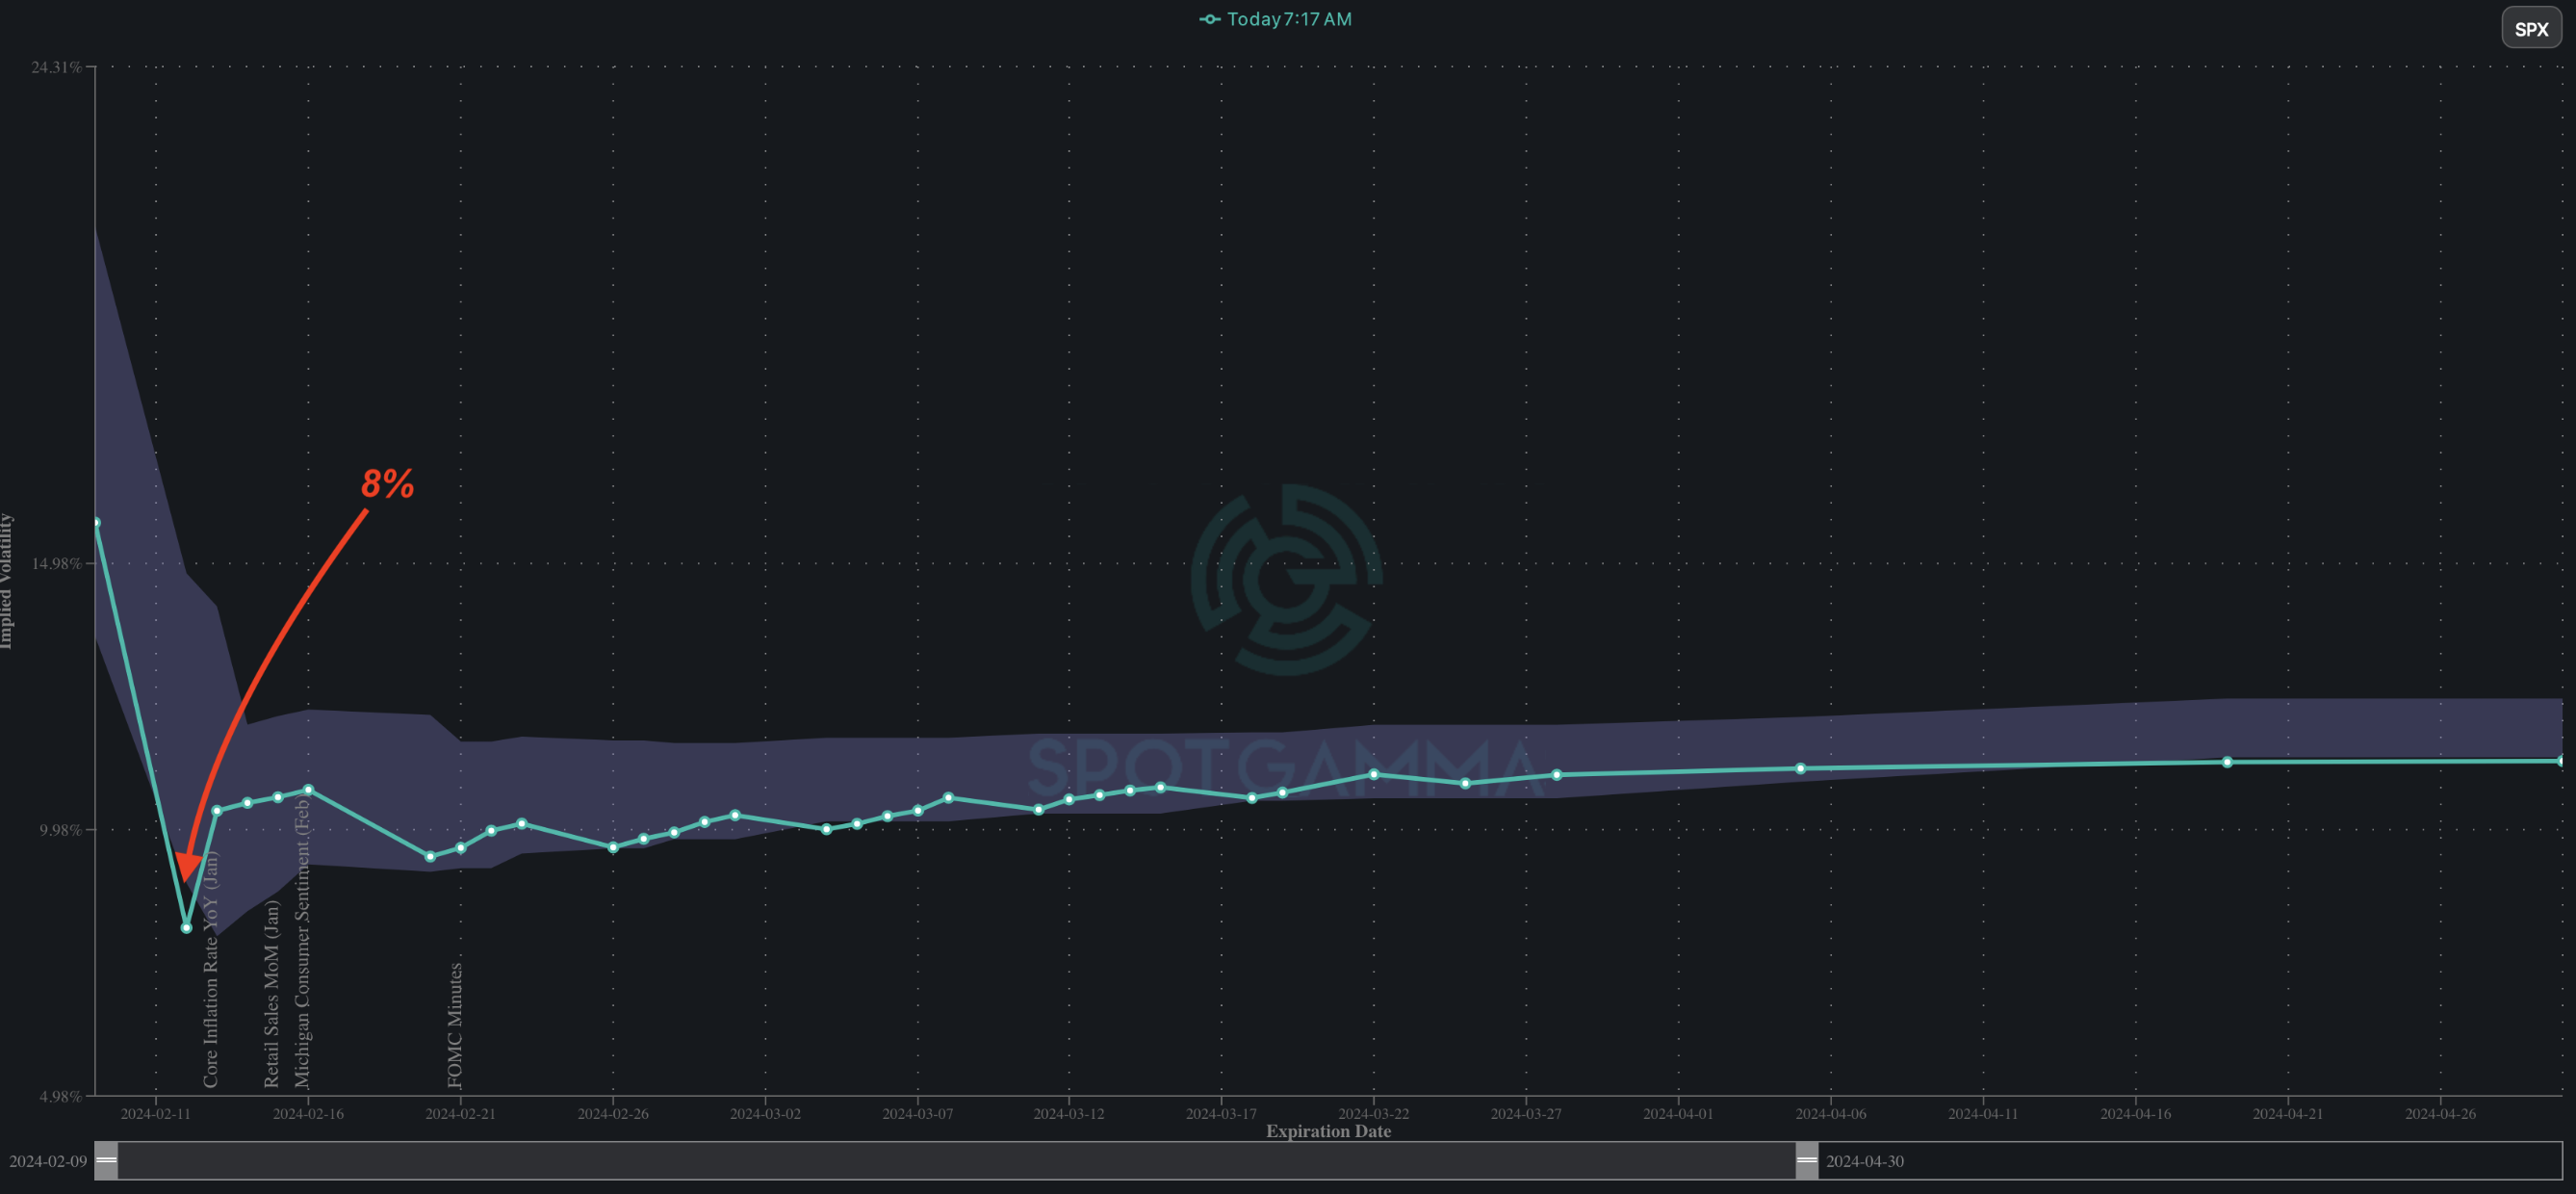
Aside from major indicies grinding higher, the other major theme has been volatility getting crushed. Mondays pre-CPI IV is now just 8%, which is as low as any IV seen this year. Further, we view 8% as a real floor in volatility expectations. This is because an 8% IV backs out to just above 50bps of daily SPX movement, and its very easy for the SPX to realize (i.e. move) more than that. Of course, these low IV’s play into the CPI/VIX Exp/OPEX triggers next week, which should remove large options positions which have reinforced this grind up/vol down movement. In other words: volatility can more freely expand with expirations.
With that, would anticipate this timeframe opening up equities for a period of short term consolidation, but we are not sold on this being a longer term top in equity markets.
On one side we have heavy call skews, outlined in yesterdays note, which suggest an overbought condition. On the other side, we have not yet seen an obvious blow-off top in the call buying data.
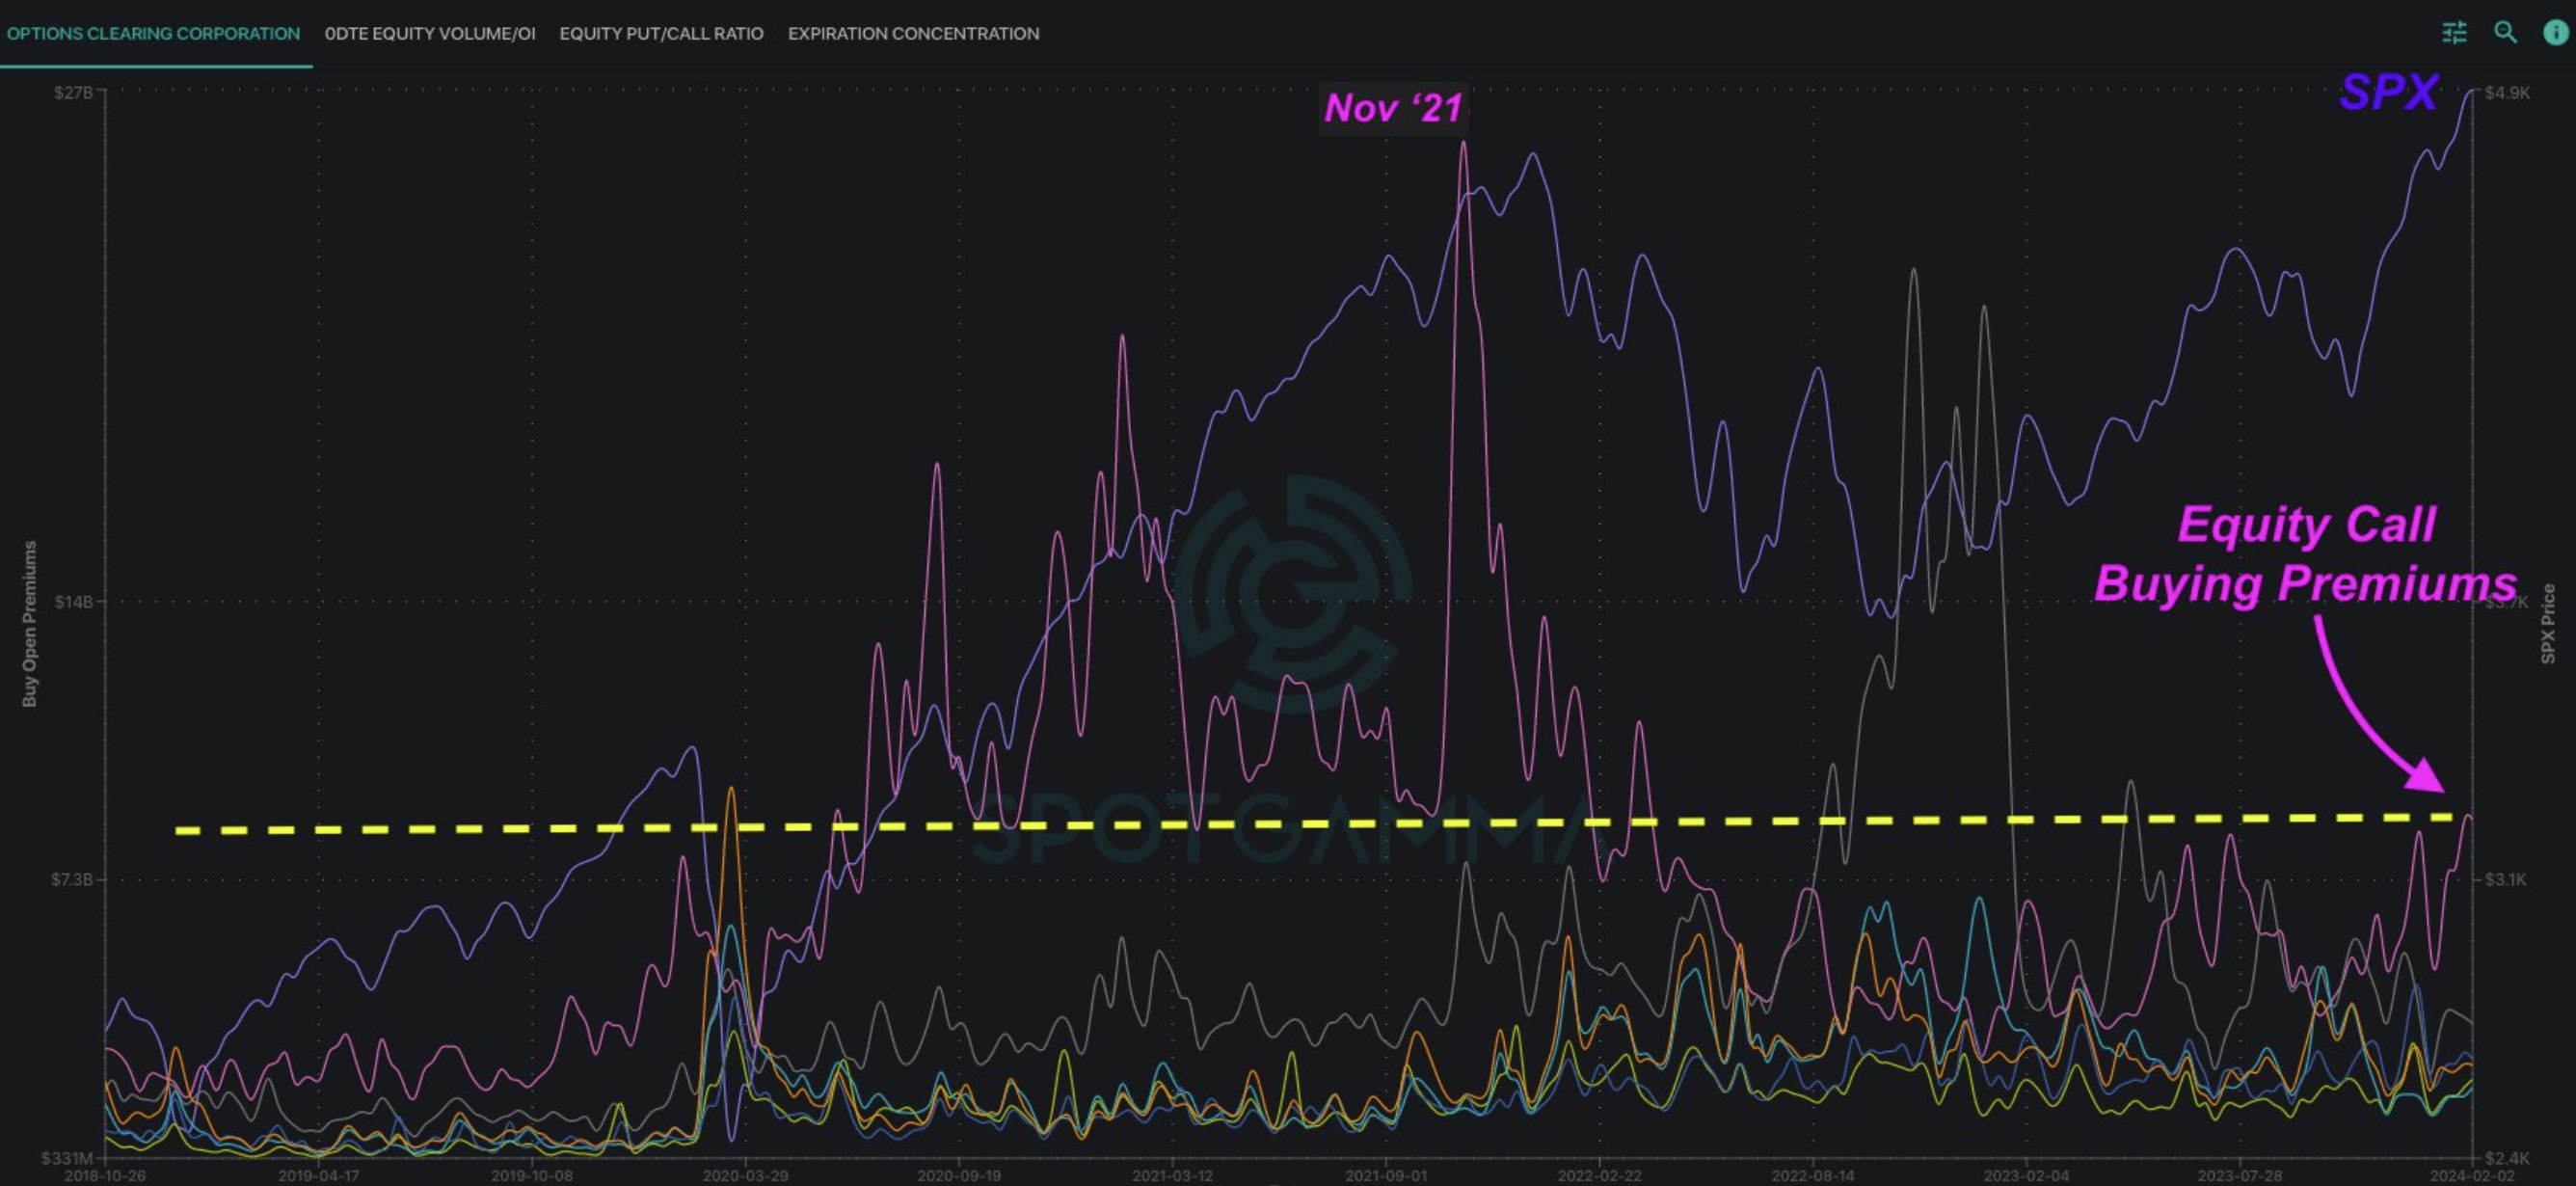
Here is data from the OCC, which inform us each week the size of options bought and sold. In this case, we see that the current level of single stock premiums spent buying calls (pink line) is at recent highs, but still well off that of the ’21 mania. If you dig into this data, you find that its a lack of buying in smaller call lot sizes, which suggests that retail has not been as involved in this rally.
One could make the argument that ’21 was an exceptional period due to direct stimulus payments, but the larger point is that it does not appear that rolling, new all-time-highs has drawn in that late stage, fresh money FOMO.
Taking a slightly different angle, if we plot out single stock
call volumes
(blue), we see that we’re pressed up against higher a trend of higher
call volumes
, but we’ve not yet seen a final surge in demand.
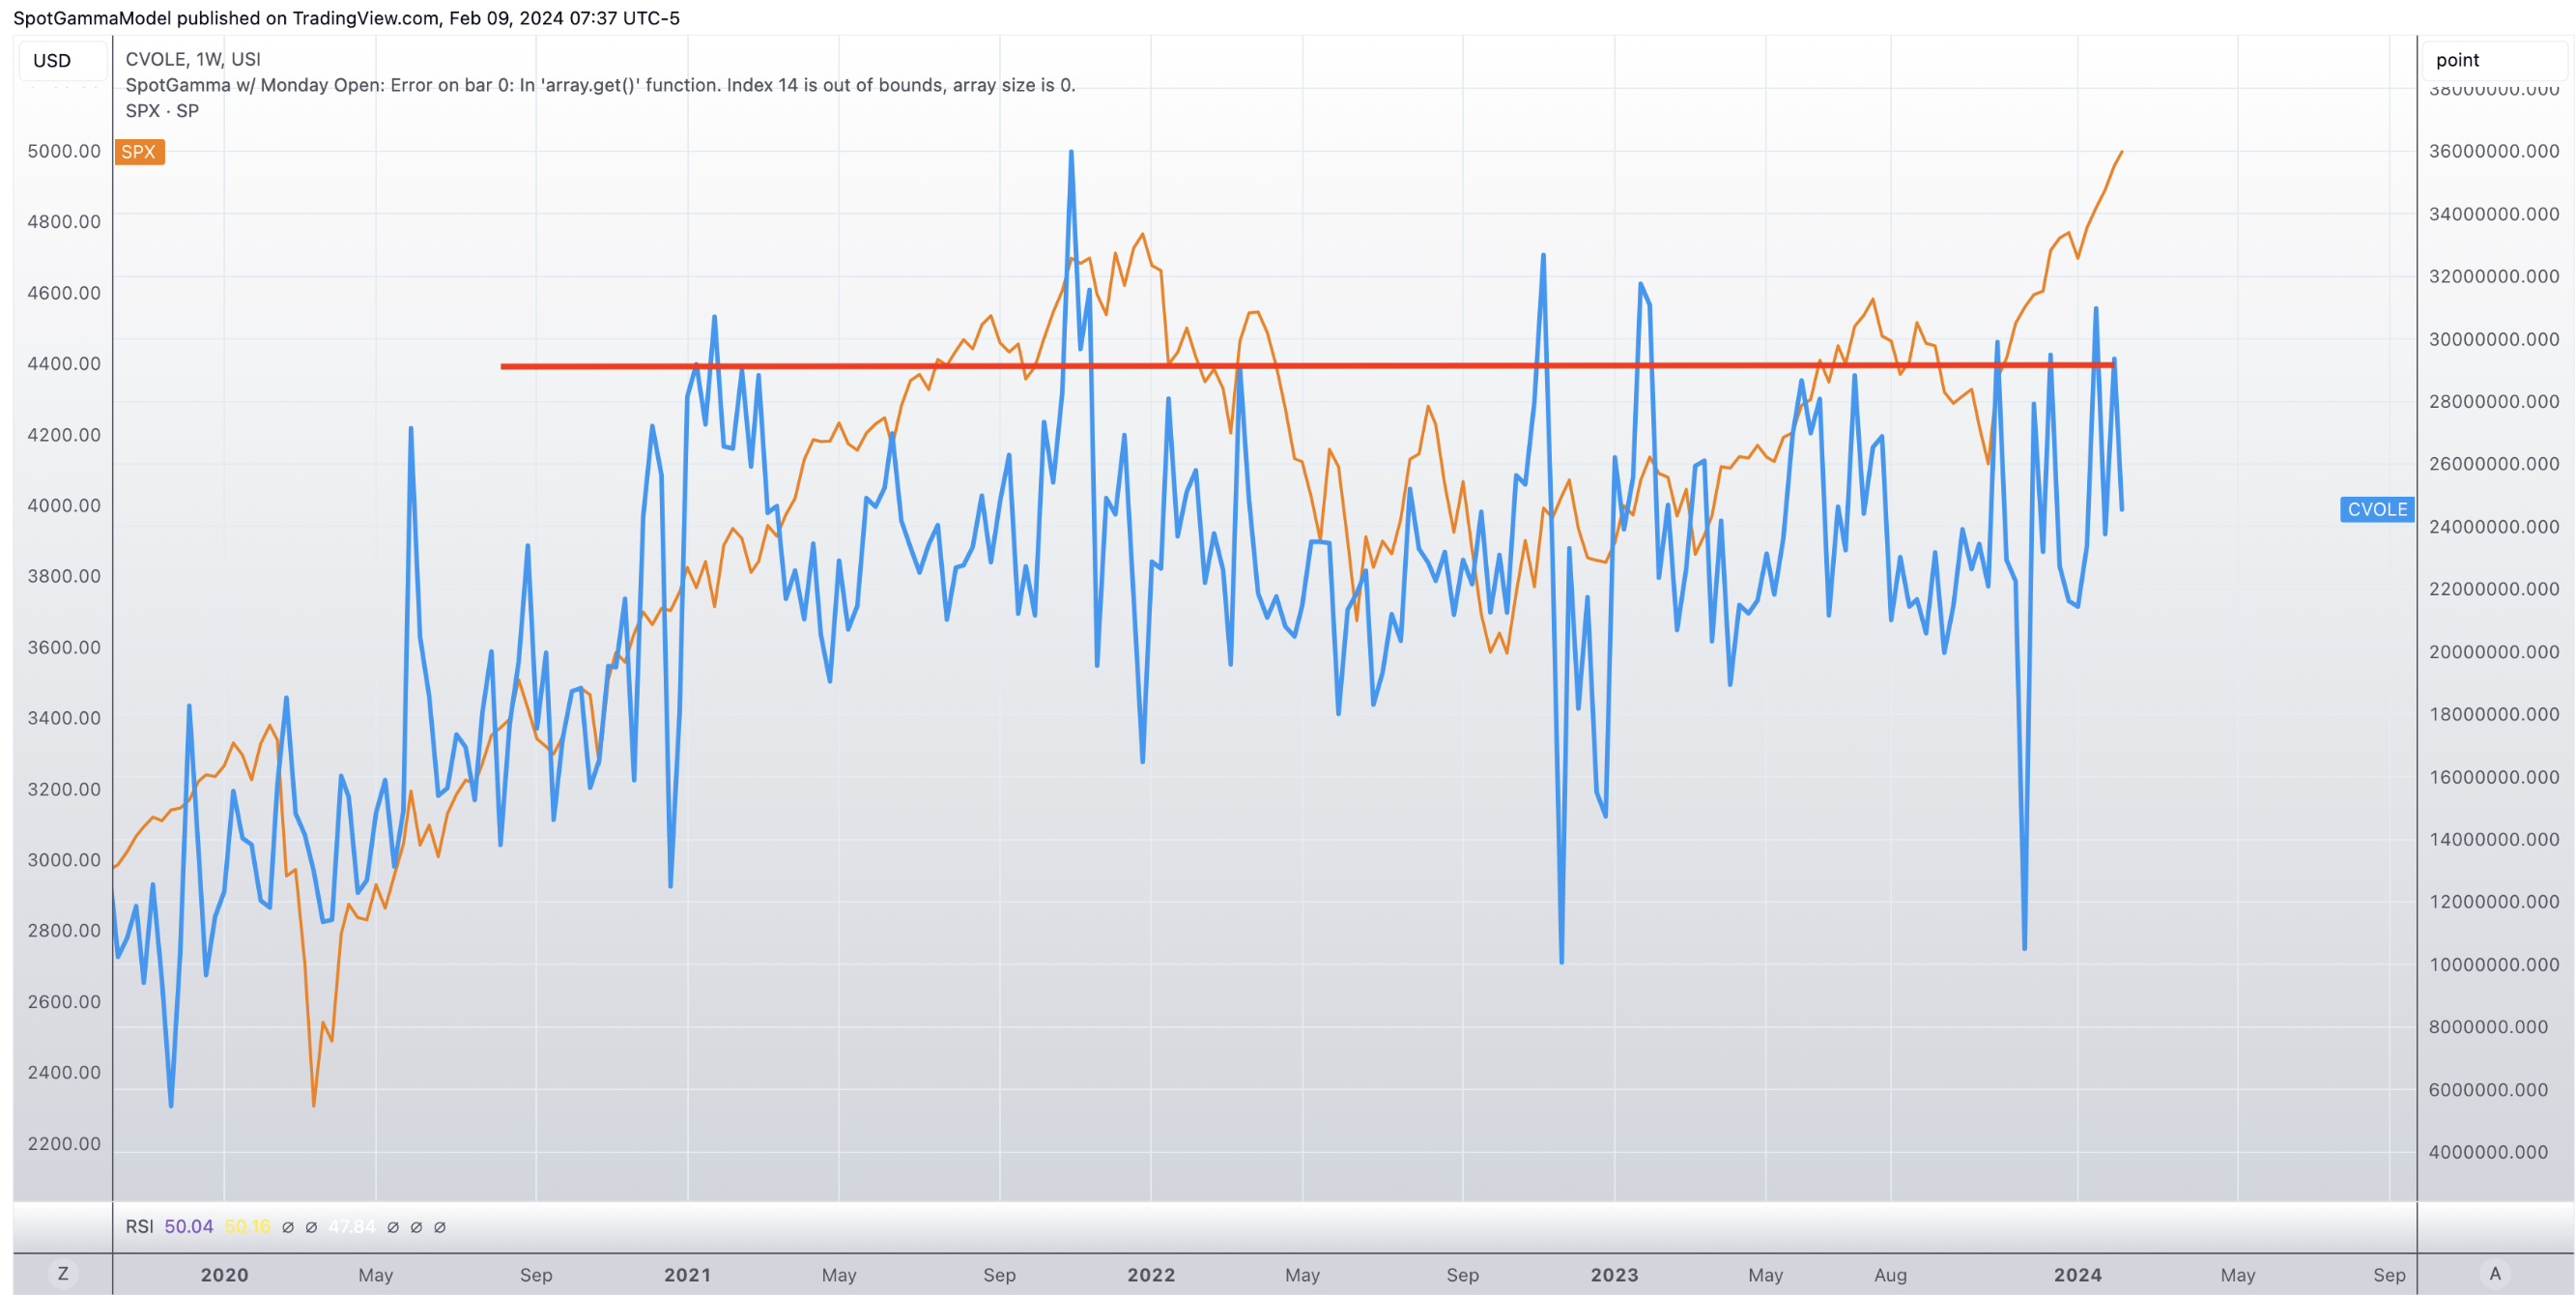
We bring these metrics up as, while we look for some post-OPEX consolidation, its not obvious that things are not yet out-of-hand on a longer term time frame.
If we break key downside
volatility triggers
, currently 4,900, then we’d look for larger, long term market weakness. However each time the SPX has seen weakness it has been met with volatility selling at our major support levels. Therefore we think that weakness should be treated as consolidation, and not “a top”, until we see meaningful support breaking accompanied by increasing implied volatility.
| SpotGamma Proprietary Levels | SPX | SPY | NDX | QQQ | RUT | IWM |
|---|---|---|---|---|---|---|
| Reference Price: | $4997 | $498 | $17783 | $432 | $1979 | $196 |
| SpotGamma Implied 1-Day Move: | 0.68% | 0.68% |
|
|
|
|
| SpotGamma Implied 5-Day Move: | 1.86% |
|
|
|
|
|
| SpotGamma Volatility Trigger™: | $4945 | $498 | $17090 | $432 | $2000 | $195 |
| Absolute Gamma Strike: | $5000 | $500 | $17100 | $430 | $2000 | $195 |
| SpotGamma Call Wall: | $5050 | $500 | $17100 | $440 | $1920 | $200 |
| SpotGamma Put Wall: | $4800 | $470 | $16000 | $415 | $1800 | $190 |
| Additional Key Levels | SPX | SPY | NDX | QQQ | RUT | IWM |
|---|---|---|---|---|---|---|
| Zero Gamma Level: | $4931 | $497 | $16701 | $428 | $2005 | $197 |
| Gamma Tilt: | 1.274 | 1.027 | 1.671 | 1.079 | 0.819 | 0.831 |
| SpotGamma Gamma Index™: | 1.848 | 0.028 | 0.078 | 0.033 | -0.018 | -0.039 |
| Gamma Notional (MM): | $592.953M | $402.151M | $9.481M | $193.23M | ‑$11.71M | ‑$258.135M |
| 25 Delta Risk Reversal: | -0.006 | 0.006 | -0.001 | 0.002 | 0.005 | 0.015 |
| Call Volume: | 515.105K | 1.503M | 15.563K | 676.519K | 15.60K | 816.903K |
| Put Volume: | 779.43K | 1.721M | 15.646K | 989.769K | 24.08K | 760.27K |
| Call Open Interest: | 6.848M | 6.707M | 55.38K | 4.246M | 250.694K | 4.644M |
| Put Open Interest: | 13.536M | 15.64M | 71.665K | 8.328M | 442.601K | 8.296M |
| Key Support & Resistance Strikes |
|---|
| SPX Levels: [5000, 4900, 4950, 4800] |
| SPY Levels: [500, 495, 498, 490] |
| NDX Levels: [17100, 17600, 17000, 17625] |
| QQQ Levels: [430, 415, 434, 425] |
| SPX Combos: [(5198,96.54), (5173,73.89), (5148,92.51), (5123,86.17), (5113,81.15), (5098,98.89), (5078,78.45), (5073,93.85), (5068,73.29), (5063,83.59), (5058,76.79), (5053,87.10), (5048,99.13), (5043,86.82), (5038,90.28), (5033,92.78), (5028,94.61), (5023,99.06), (5018,92.26), (5013,99.15), (5008,96.15), (5003,99.04), (4973,95.24), (4948,93.02), (4918,73.68), (4848,81.07), (4798,85.78)] |
| SPY Combos: [498.91, 508.88, 501.4, 503.89] |
| NDX Combos: [18085, 17872, 17107, 17837] |
| QQQ Combos: [440.99, 435.79, 434.93, 416.75] |
0 comentarios