
Macro Theme:
Short Term SPX Resistance: 5,000
Short Term SPX Support: 4,900
SPX Risk Pivot Level: 4,900
Major SPX Range High/Resistance: 5,100
Major SPX Range Low/Support: 4,800
‣ Volatility should continue to contract into 2/14 VIX expiration – 2/16 equity expiration. Major downside “risk-off” occurs on a break of 4,900, which is our first major support. 5,000 – 5,015 (SPY 500) is major resistance.*
*updated 2/9. Our view above, from 2/7, was updated to account for the huge gamma size at SPY 500 (SPX 5,015 equivalent).
Founder’s Note:
ES Futures are up 32bps to 4,987. NQ futures down 50 bps to 17,765.
Key SG levels for the SPX are:
- Support: 4,945, 4,910, 4,900
- Resistance: 4,973, 5,000, 5,015
- 1 Day Implied Range: 0.63%
For QQQ:
- Support: 428, 425
- Resistance: 430, 440
Call Wall
IWM:
- Support: 190
- Resistance: 196, 200
Call Wall
This morning is the VIX expiration at 9:30AM ET. Be aware of sharp, potentially unusual market moves into & around that time.
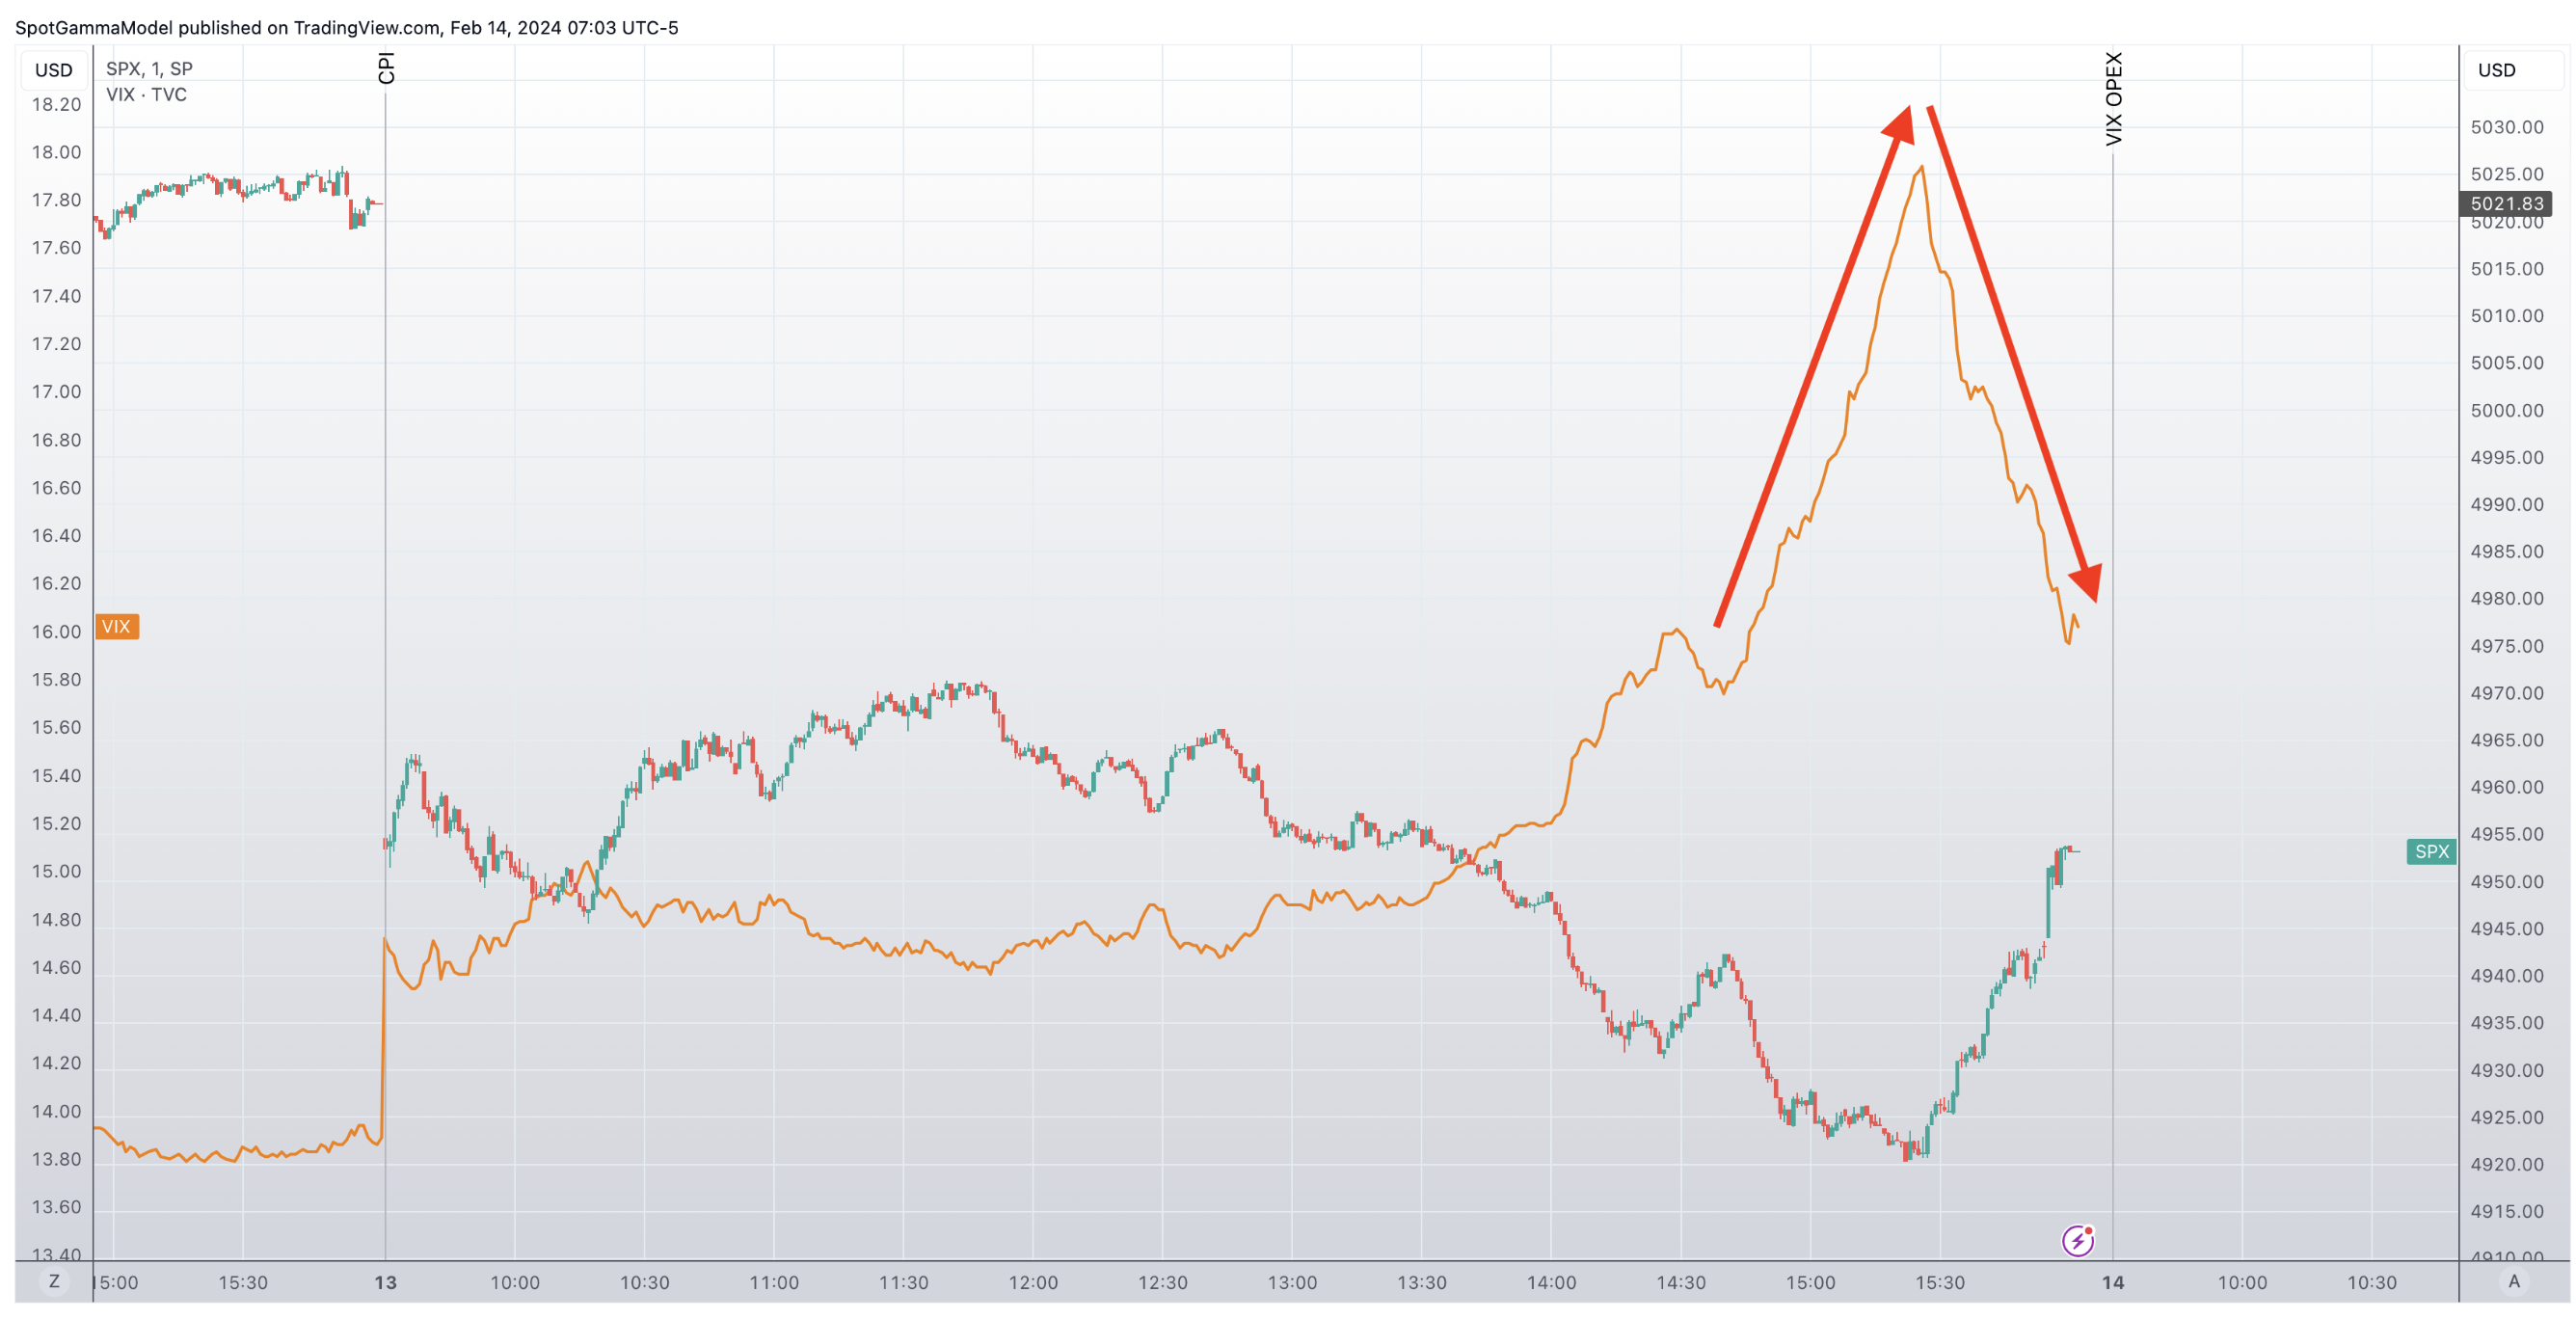
Our view heading into the CPI/VIX exp/OPEX catalysts was that equities were due for some consolidation, with 4,900 as primary support. The SPX nearly achieved tagging that major support level (intraday low 4,920), before putting in a solid bounce. Bulls are not out of the woods yet, and we remain directionally neutral on the SPX until 5,000 is recovered. To the downside, we continue to operate off of the view that 4,900 is major short term support, with that 5,000-5,015 major resistance for today. A break of 4,900 would be a major, long term risk-off signal. See yesterday’s map for more.
On the topic of the VIX, yesterday saw a massive 1.6mm VIX call contracts trading, placing it in the top 1% of volume sessions since ’21. With that, we saw very heavy customer call selling (nearly 3:1 selling vs buying) related to today’s expiration and next months March expiration. This appears to be traders taking advantage of that rather unusual afternoon VIX ramp, highlighted below. Based on the price action, that VIX move gave us this sense that someone was forced to cover some type of VIX short, but that is pure conjecture.
The important takeaway here is that the VIX ramp was sold hard, but we are not yet out of the woods in terms of potential VIX shifts, due to today’s expiration. We could see VIX pop or plunge today, simply off of positioning effects, and so one should not necessarily make longer term trading decisions from today’s movement. The signal that the selling is “real” would come from IV shifting higher for downside puts. You could see this in fixed strike vol readings, skew, or some indexified measures like the SDEX.
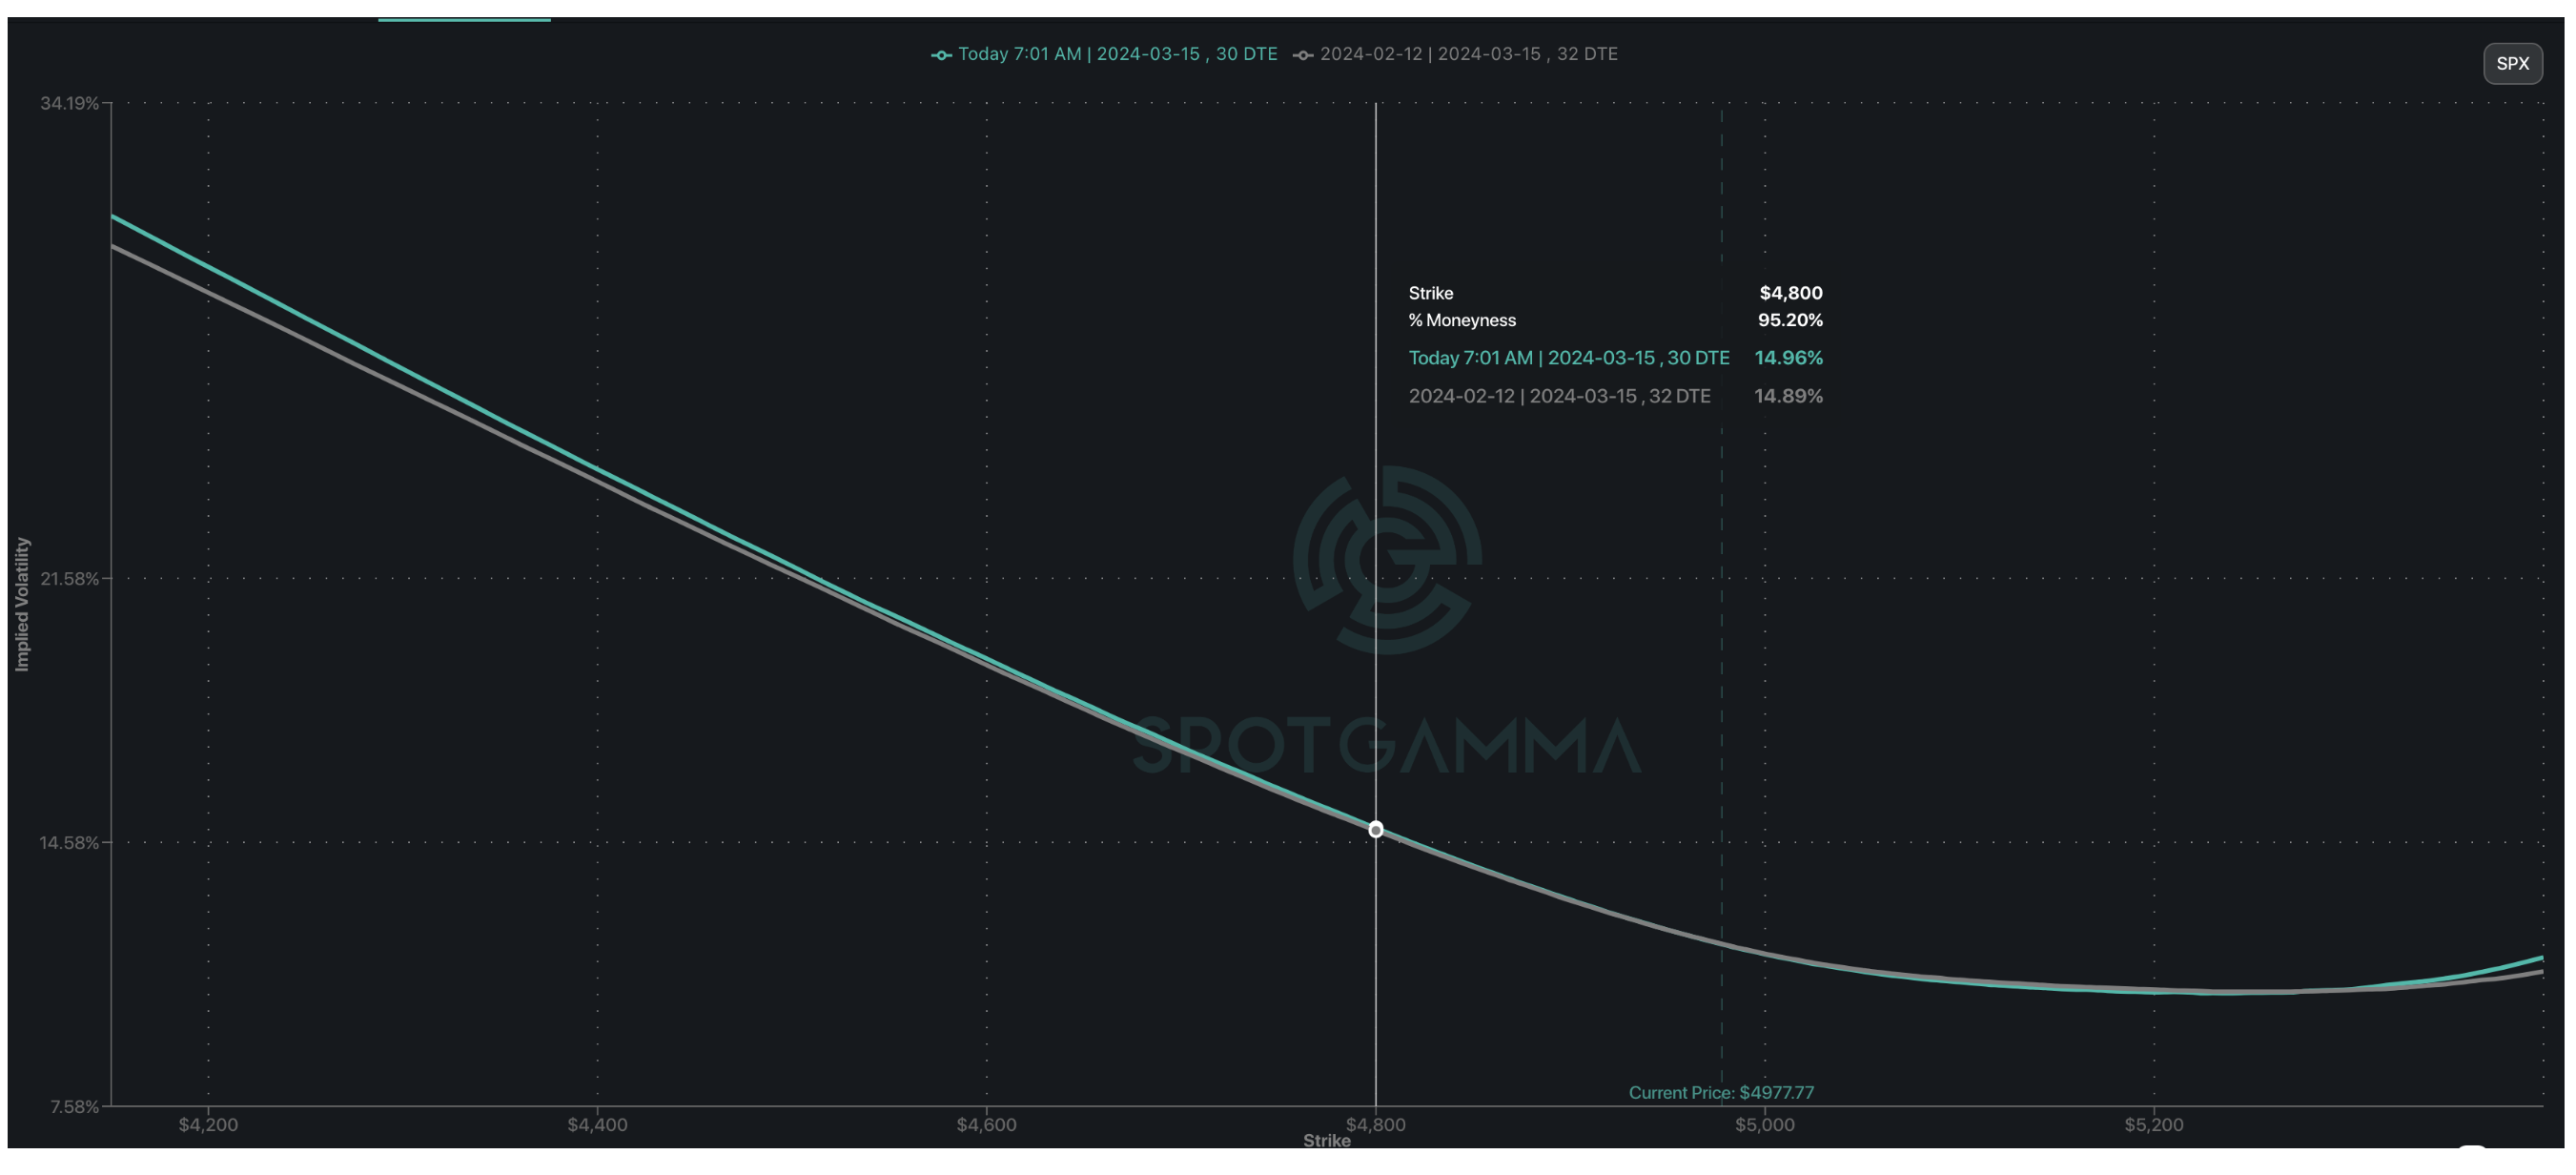
On that point, if we step back from the VIX and look at SPX vol, we see that IV on a fixed strike basis remains rather unchanged from Monday’s pre-CPI readings. This can be seen in the plot below of 1-month SPX skew, which is essentially unchanged from Monday’s close to this morning. This informs us that traders did not seek to materially get long volatility/puts in any type of meaningful way, despite the fact that equities moved sharply lower. What we do see is some evidence that call skews came in, which means yesterday may have been a bit more about zapping some of the recent call-led exuberance vs trying to short this market.
The reality is, we received a volatility “warning shot” yesterday, but traders have not planned out their reactions. Just as the SPX is in the neutral zone of 4,900’s handle prices, IV remain neutral as well. On one hand there is some room for traders to step up and sell volatility/puts, which would propel stocks higher, or long demand could start to materialize. It’s a fluid situation, but a directional move likely sets up on either a break <4,900 or shift >5,000.
| SpotGamma Proprietary Levels | SPX | SPY | NDX | QQQ | RUT | IWM |
|---|---|---|---|---|---|---|
| Reference Price: | $4953 | $494 | $17600 | $428 | $1964 | $194 |
| SpotGamma Implied 1-Day Move: | 0.63% | 0.63% |
|
|
|
|
| SpotGamma Implied 5-Day Move: | 1.83% |
|
|
|
|
|
| SpotGamma Volatility Trigger™: | $4945 | $493 | $17075 | $428 | $1950 | $196 |
| Absolute Gamma Strike: | $5000 | $495 | $17100 | $430 | $2000 | $190 |
| SpotGamma Call Wall: | $5000 | $500 | $17100 | $440 | $1920 | $200 |
| SpotGamma Put Wall: | $4910 | $490 | $17200 | $420 | $1850 | $190 |
| Additional Key Levels | SPX | SPY | NDX | QQQ | RUT | IWM |
|---|---|---|---|---|---|---|
| Zero Gamma Level: | $4961 | $493 | $16780 | $427 | $2019 | $199 |
| Gamma Tilt: | 1.036 | 0.955 | 1.563 | 0.904 | 0.824 | 0.725 |
| SpotGamma Gamma Index™: | 0.270 | -0.057 | 0.078 | -0.051 | -0.02 | -0.065 |
| Gamma Notional (MM): | ‑$127.914M | ‑$155.901M | $8.175M | ‑$222.917M | ‑$20.914M | ‑$625.272M |
| 25 Delta Risk Reversal: | -0.023 | -0.035 | -0.028 | -0.03 | -0.027 | -0.025 |
| Call Volume: | 537.211K | 2.928M | 7.80K | 1.117M | 39.752K | 936.394K |
| Put Volume: | 1.361M | 3.788M | 11.35K | 1.884M | 68.32K | 1.163M |
| Call Open Interest: | 6.687M | 7.217M | 56.328K | 4.298M | 275.48K | 4.455M |
| Put Open Interest: | 13.726M | 16.38M | 75.136K | 8.221M | 502.191K | 8.185M |
| Key Support & Resistance Strikes |
|---|
| SPX Levels: [5000, 4900, 4950, 4800] |
| SPY Levels: [495, 490, 500, 494] |
| NDX Levels: [17100, 17000, 17600, 17625] |
| QQQ Levels: [430, 425, 424, 415] |
| SPX Combos: [(5151,90.63), (5127,81.36), (5102,98.59), (5082,74.77), (5077,87.56), (5062,81.23), (5052,98.04), (5032,85.92), (5027,93.31), (5013,98.31), (4998,99.20), (4988,74.38), (4983,75.71), (4973,95.81), (4963,89.36), (4953,78.18), (4948,94.96), (4938,77.14), (4933,73.39), (4923,75.13), (4918,87.25), (4914,86.94), (4909,92.42), (4904,72.31), (4899,86.17), (4894,88.14), (4884,89.89), (4879,76.18), (4874,81.30), (4864,78.98), (4849,91.17), (4834,73.04), (4824,72.06), (4800,87.43), (4750,88.76), (4710,74.47)] |
| SPY Combos: [489.17, 494.08, 498.99, 508.32] |
| NDX Combos: [17108, 18076, 17460, 17037] |
| QQQ Combos: [430.81, 429.53, 421.01, 427.82] |
0 comentarios