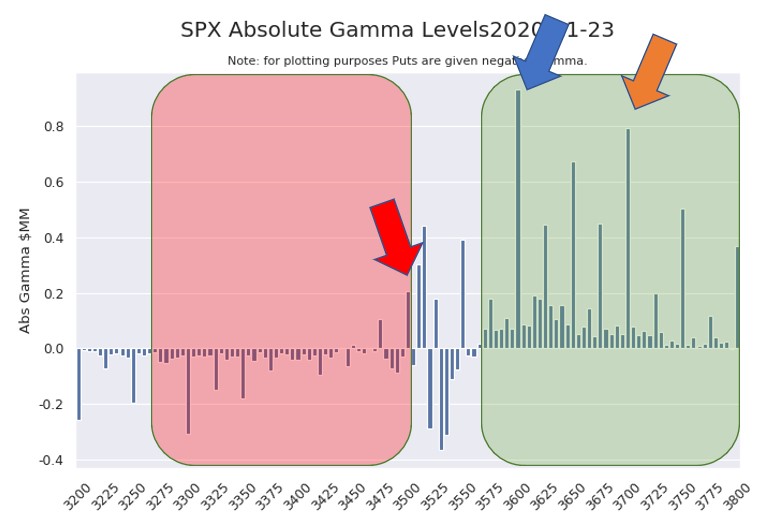
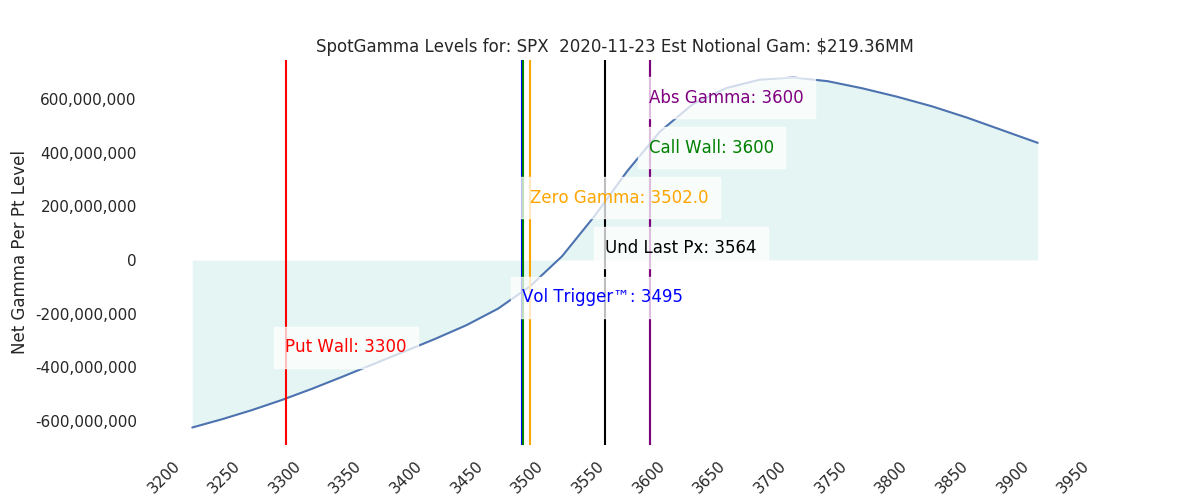
Futures are up this morning likely buoyed by Pfizer’s updated vaccine release. The Nov expiration appeared to have little impact in levels with the Call Wall holding 3600 (blue arrow, below) and the Zero Gamma (red arrow) level at 3500. Whereas last week we looked for a rangebound market, we now look for a range break, but need markets to indicate direction.
The issue with giving an edge to a particular side is that most of the SPX gamma lies >3600. This makes the Call Wall the “left tail” of the positive gamma, wherein usually we would see the Call Wall mark the “right tail” of the gamma distribution (orange arrow). This forms our resistance point at the start of what we usually view as the “positive return safe zone”.
To a similar point is the interesting dichotomy in volatility. Note the sharp decrease in 5 day realized volatility (red line, bottom pane) after a the fairly tight SPX range from last week (recall we mentioned that data supports OPEX week leading to lower SPX volatility).
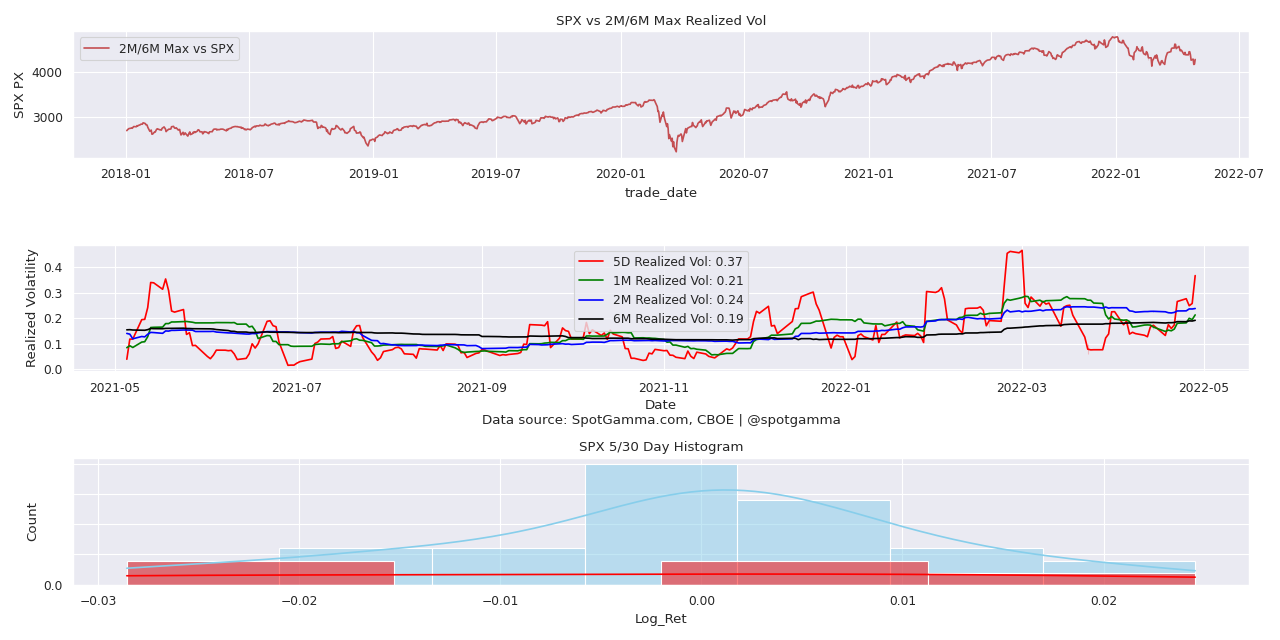
This window is contrasted against the VIX which carries an estimated 1.4% move, and the SG Index which implies a 1.2% move. “Lack of movement” in markets eventually creates a tailwind for prices, as the reduction in implied volatility incents dealer buying in futures.
Therefore we don’t think price can simply stall here as this volatility premium would leak out and push the VIX lower. Its of note the last two times the 5D realized hit this level was the start of June and then August – both saw quick moves higher in the SPX. This is not to minimize the downside risk which remains robust, with those large DEC put positions sitting under 3500.
Our initial range into the DEC OPEX cycle remains as mentioned Friday: 3600-3500. Its likely 3500 remains the key major support level for some time. On a slightly larger timeframe the obvious target to the upside is 3700 as a lot of call gamma has formed there. As usual, we’ll want the Call Wall to shift higher to sync with any move up, but essentially we view any “confirmed” break of 3600 leading to a quick run to 3700.
For today we note key resistance at 3592, with support at 3550. 3567 appears as a pivot area.
Macro Note:
DEC Range will setup next week.
| SIGNAL NAME | LATEST DATA | PREVIOUS | SPY | NDX | QQQ | ||
|---|---|---|---|---|---|---|---|
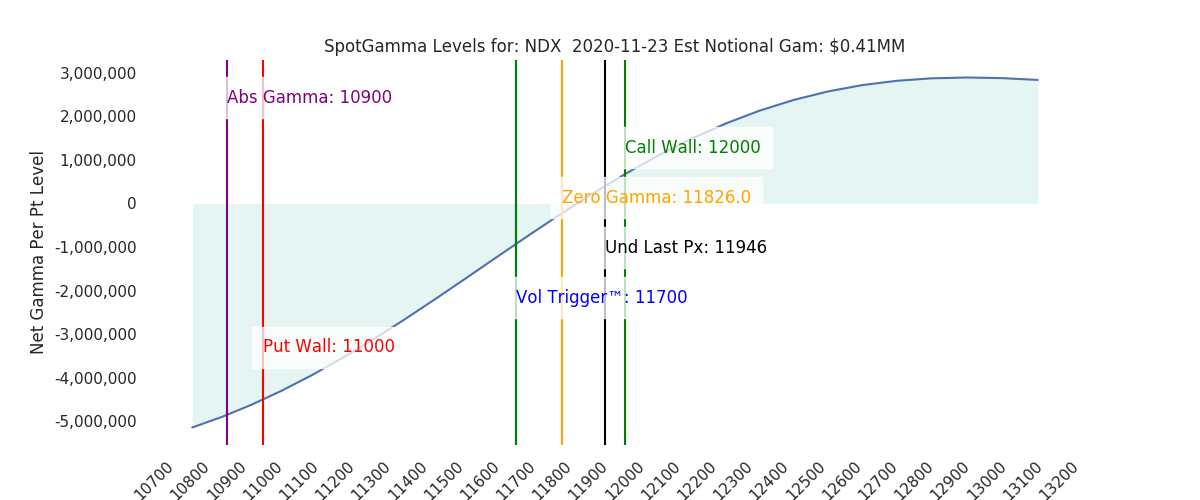
| Ref Price: | 3564 | 3543 | 356 | 11946 | 290 | ||
| VIX Ref: | 14 | 23.7 | |||||
| SG Gamma Index™: | 0.47 | 0.93 | 0.15 | 0.00 | -0.01 | ||
| Gamma Notional(MM): | $219.00 | $113.00 | $1,102.00 | $0.00 | $-91.00 | ||
| SGI Imp. 1 Day Move: | 1.22%, | 43.0 pts | Range: 3527.0 | 3613.0 | ||||
| SGI Imp. 5 Day Move: | 3564 | 1.96% | Range: 3494.0 | 3634.0 | ||||
| Zero Gamma Level(ES Px): | 3502 | 3508 | — | 0 | |||
| Vol Trigger™(ES Px): | 3495 | 3445 | 356 | 11700 | 290 | ||
| SG Abs. Gamma Strike: | 3600 | 3600 | 350 | 10900 | 280 | ||
| Put Wall Support: | 3300 | 3200 | 350 | 11000 | 265 | ||
| Call Wall Strike: | 3600 | 3600 | 370 | 12000 | 300 | ||
| CP Gam Tilt: | 1.22 | 1.07 | 1.46 | 1.04 | 0.9 | ||
| Delta Neutral Px: | 3389 | ||||||
| Net Delta(MM): | $11,501.00 | $13,917.00 | $1,920.00 | $376.00 | $617.00 | ||
| 25D Risk Reversal | -0.08 | -0.06 | -0.07 | -0.07 | -0.08 | ||
| Top Absolute Gamma Strikes: SPX: [3600, 3550, 3500, 3450] SPY: [370, 360, 355, 350] QQQ: [300, 290, 285, 280] NDX:[12000, 11300, 11000, 10900] SPX Combo: [3617.0, 3642.0, 3567.0, 3620.0, 3592.0] NDX Combo: [11896.0, 11591.0, 11661.0] The Volatility Trigger has moved UP: 3495 from: 3445 The PutWall has moved to: 3300 from: 3200 SPX resistance is: 3600 .Reference ‘Intraday Support’ levels for support areas. The total gamma has moved has moved UP: $219.00MM from: $112.00MM Gamma is tilted towards Puts, may indicate puts are expensive Positive gamma is moderate which should lead to smaller market moves. Average Range on day is 1.5% |

0 comentarios