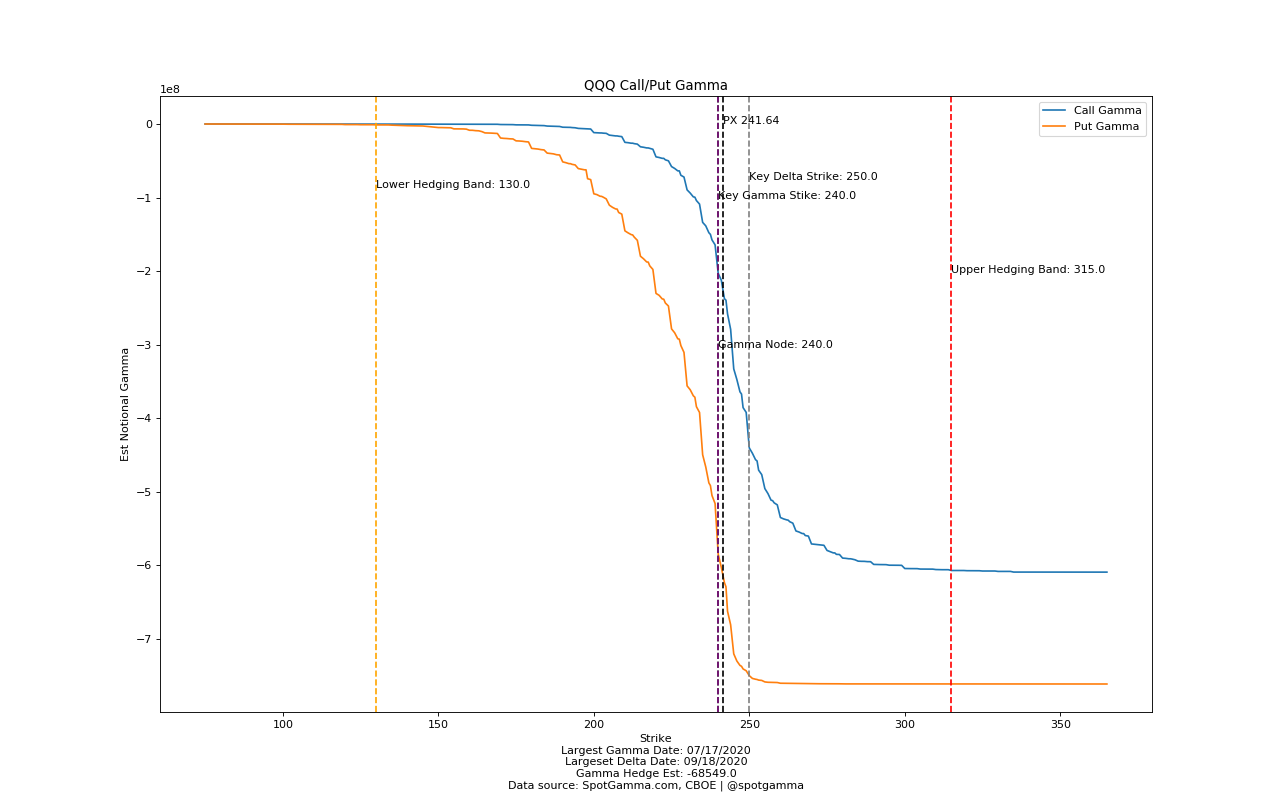
| Futures held a pretty tight range overnight and are at 3200 currently, which is highlighted as our key strike today. The SG Index is higher which suggests a tighter trading range today, but not quite that much considering how high call volume was Friday. Its notable there was a drawdown in notional gamma. This is due to a net reduction in calls under 3175 (OI Change charts here). This type of activity we have seen a lot recently where strips of calls below the market are removed, and I’d assume many are rolled higher. 3200 strike volume was quite large at 100k on Friday with only 30k puts trading there with most put activity down towards 3100. Its clear that call prices made a big jump vs put prices if you look at this chart and may be a sign of bullish excess. From my seat and judging strictly from options data I see signs of froth much like in February. I am not suggesting we have a large crash but my data is suggesting correction. The timing is certainly key and I point to the large SPX monthly expiration (6/19) as a possible catalyst. Not only is this the largest concentration of options for SPX, but also about 40% of the equities I surveyed. We usually look to OPEX as that can be when lot of options are going to be wiped off the board and hedges adjusted/unwound. Concerning today we do not see signs of a larger drawdown, with 3200 being the key pivot area. The SPX/SPY combo chart shows a key level at 3208 and first resistance with 3225 above that. Below we look at 3180. Despite the apparent reduction in calls the SPX does show still show a healthy amount of gamma and we anticipate this as a mean reversion day. Several of you have been asking for Nasdaq/QQQ data which we have started calculating, you can see a gamma chart here showing 240 as the top gamma level. We’ll be expanding this QQQ/Nasdaq data ASAP. |
| Market Outlook: |
| Support at 3100 into June, with a break in bull trend and higher volatility not anticipated unless we break 3050. 3150 is current resistance. Higher gamma levels suggest the market is fairly well supported. |
| Event | Time EST | Actual | Forecast | Previous |
| No events | – | – | – | – |
| Signal Name | Latest Data | Previous |
| SPX Ref: | 3199 | 3187 |
| VIX Ref: | 25.05 | 24.37 |
| SG Gamma Index: | 0.80 | 0.47 |
| Gamma Notional: | $525.62MM | $638.37MM |
| SGI Imp. 1SD Move: | 0.8% | 3173.408 | 3224.592 |
| Zero Gamma Level: | 3019.0 | 3039.0 |
| Vol Trig: | 3025 | 3045 |
| High Gamma Strike Resistance: | 3200 | 3150 |
| Top Abs. Gamma Strike: | 3200 | 3000 |
| Put Wall Support: | 3180 | 2800 |
| Call Wall Strike: | 3200 | 3150 |
| CP Gam Tilt: | 1.46 | 1.6 |
| Delta Neutral Px: | 2922.0 | |
| Net Delta: | $16,596.67MM | $16,175.25MM |
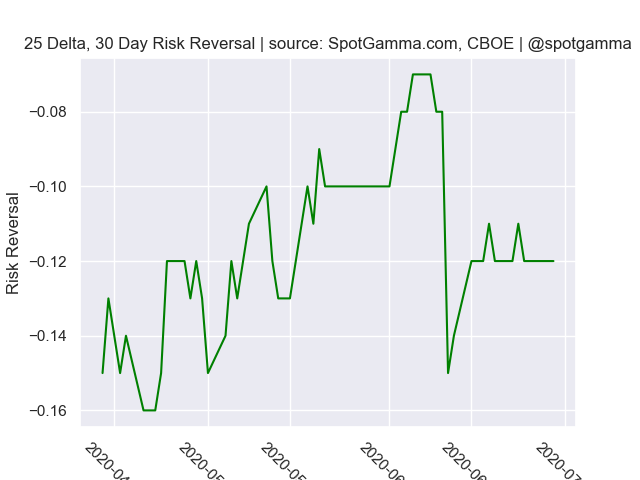
| 25D Risk Reversal | -0.07 | -0.08 |
| Model Forecast: |
| Top Absolute Gamma Strikes: [3300, 3250, 3200, 3175, 3150, 3100, 3050, 3000, 2900, 2800] The Volatility Trigger has moved DOWN: 3025 from: 3045 The PutWall has moved to: 3180 from: 2800 The Call Wall has moved to: 3200 from: 3150 The High Gamma Strike has moved to: 3200 from: 3150 SPX resistance is: 3200 .Reference ‘Intraday Support’ levels for support areas. The total gamma has moved DOWN: $525.62MM from: $638.00MM Gamma is tilted towards Puts, may indicate puts are expensive Positive gamma is moderate which should lead to smaller market moves. Average Range on day is 1.5% |