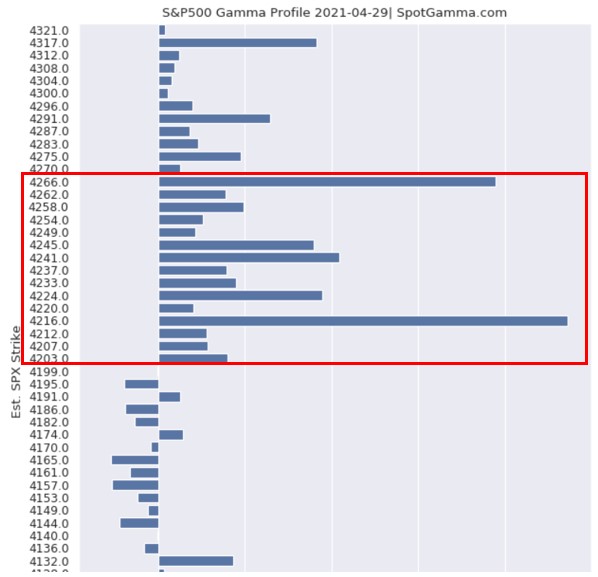
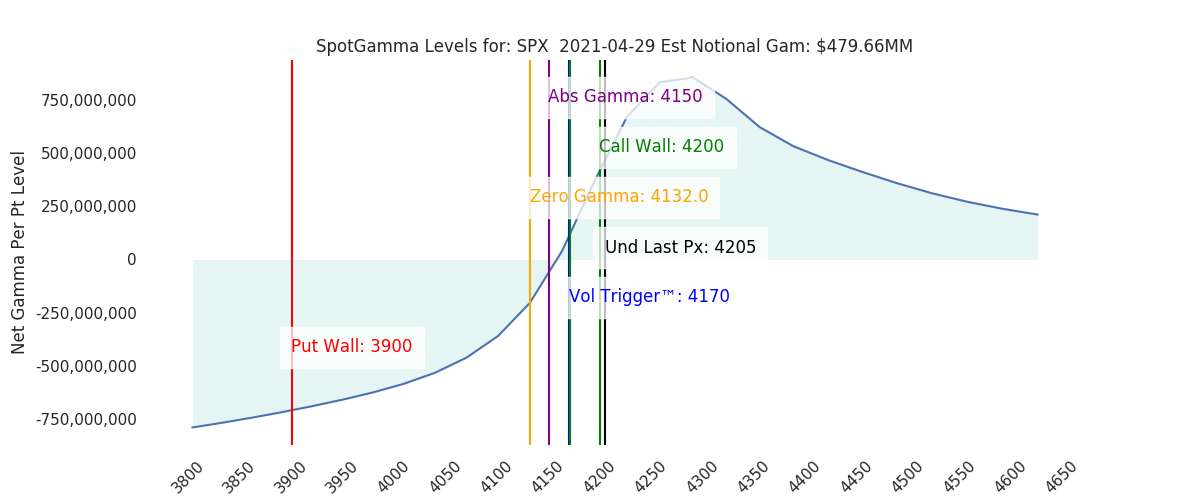
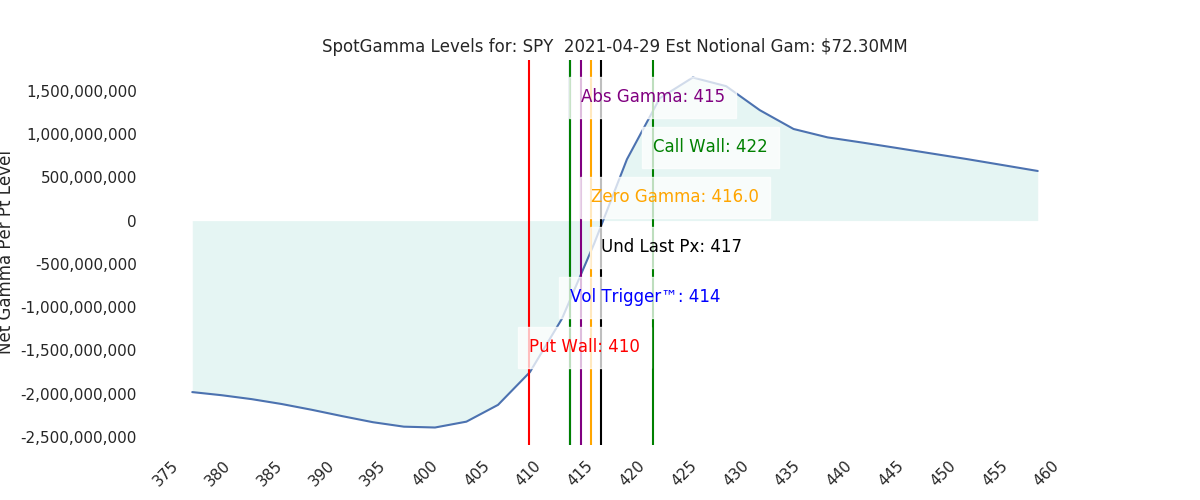
Futures have popped to new highs at 4205. The Call Wall did not shift higher for the SPX, but did bump to 422 for the SPY. If we combine all of the S&P gamma, this gives us a “blended” Call Wall of 4216. You can see this total S&P gamma in the chart below, note the bulk of positive gamma strikes sit in the 4216-4240 area. We’d consider this area “fair value” from an options perspective. The Vol Trigger line also pushed higher to 4170 which is now considered critical support.
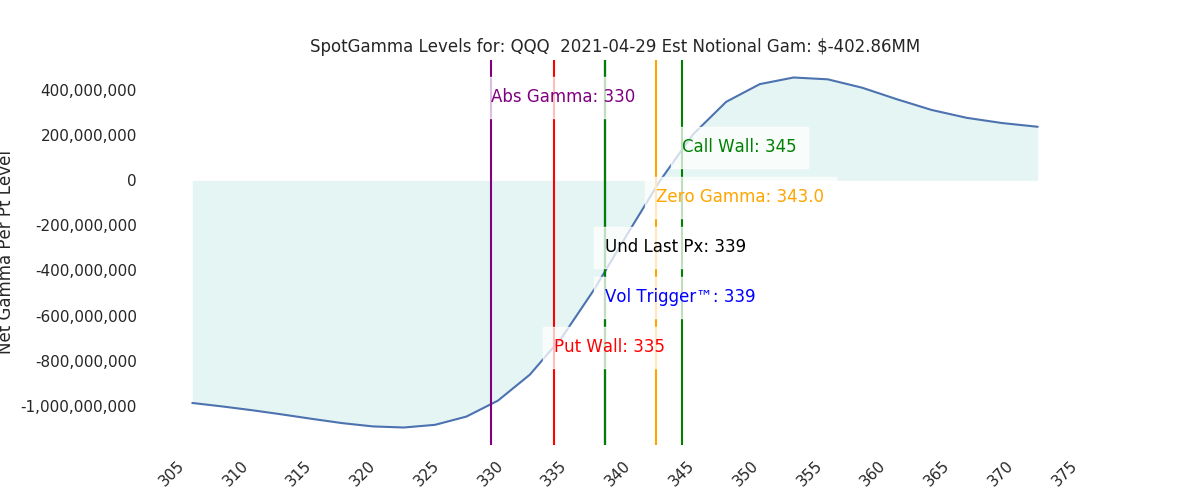
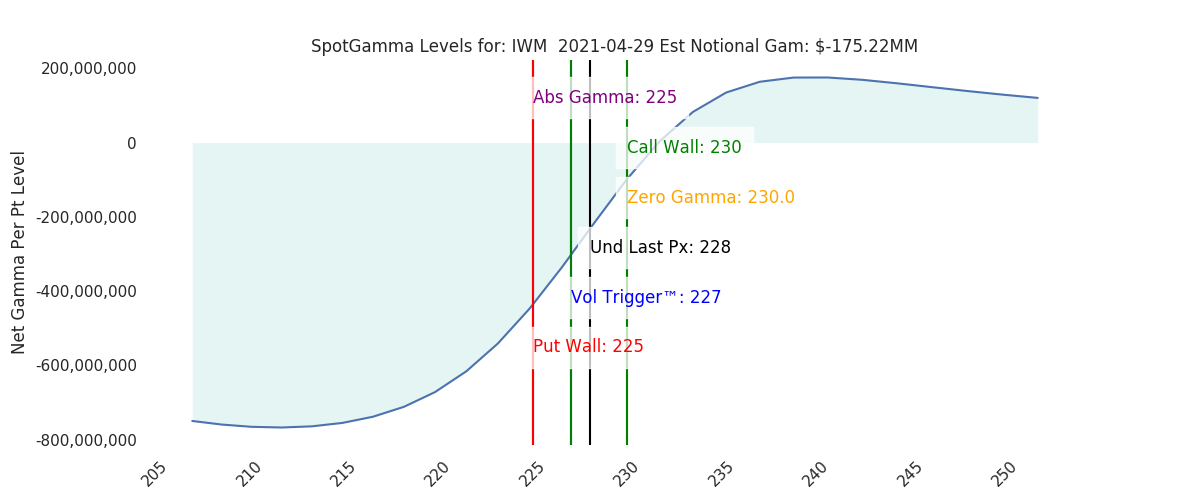
Overall gamma did not move higher suggesting there was not much call activity yesterday (in any index). QQQ & IWM both start in a negative gamma position which as noted yesterday imply dealers will be trading along with the market, pushing in the prevailing direction and expanding volatility (in QQQ/IWM).
We still track ~20% of S&P gamma and ~30% of QQQ gamma expiring Friday. These are large amounts. Everything we’re seeing seems to point to a fairly volatile period over the next several days, particularly to start next week. This volatility does not have to necessarily manifest in lower markets, it could also indicate a breakout to the upside. We are currently giving the “upside” an edge due to the negative gamma position in QQQ/IWM. Large amounts of puts expiring could lead to a vanna/charm induced dealer buyback.
Model Overview:
4000 – 4200 range into May OPEX. Gamma is currently moderate, and we see fairly low S&P volatility unless markets break the 4170 level.
| SpotGamma Proprietary Levels | Latest Data | Previous | SPY | NDX | QQQ | ||
|---|---|---|---|---|---|---|---|
| Ref Price: | 4199 | 4184 | 417 | 14004 | 339 | ||
| SGI Imp. 1 Day Move: | 1.1%, | 46.0 pts | Range: 4153.0 | 4245.0 | ||||
| SGI Imp. 5 Day Move: | 4168 | 1.83% | Range: 4092.0 | 4245.0 | ||||
| SG Gamma Index™: | 0.83 | 1.17 | 0.04 | 0.03 | -0.07 | ||
| Vol Trigger™(ES Px): | 4170 | 4095 | 414 | 13475 | 339 | ||
| SG Abs. Gamma Strike: | 4150 | 4150 | 415 | 14025 | 330 | ||
| Gamma Notional(MM): | $409 | $368 | $72 | $2 | $-403 | ||
| Additional Key Levels | Latest Data | Previous | SPY | NDX | QQQ |
|---|---|---|---|---|---|
| Zero Gamma Level(ES Px): | 4157 | 4143 | — | 0 | |
| Put Wall Support: | 3900 | 3900 | 410 | 13375 | 335 |
| Call Wall Strike: | 4200 | 4200 | 422 | 14025 | 345 |
| CP Gam Tilt: | 1.3 | 1.27 | 1.02 | 1.27 | 0.74 |
| Delta Neutral Px: | 3963 | ||||
| Net Delta(MM): | $1,333,554 | $1,331,869 | $189,616 | $41,156 | $74,267 |
| 25D Risk Reversal | -0.06 | -0.07 | -0.06 | -0.05 | -0.06 |
| Top Absolute Gamma Strikes: |
|---|
| SPX: [4200, 4175, 4150, 4000] |
| SPY: [420, 418, 417, 415] |
| QQQ: [340, 338, 335, 330] |
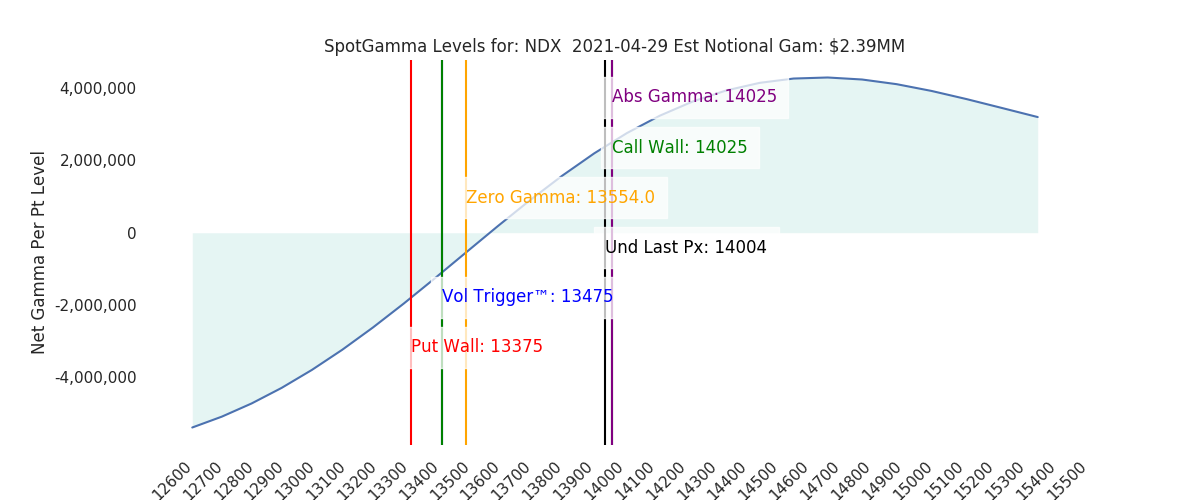
| NDX:[14025, 14000, 13750, 12850] |
| SPX Combo: [4216.0, 4266.0, 4241.0, 4224.0, 4317.0] |
| NDX Combo: [14125.0, 13831.0, 13621.0, 14251.0, 13915.0] |
| Sub Login Support Follow @SpotGamma Strike Charts Historical Chart Gamma Expiration Tool |
0 comentarios