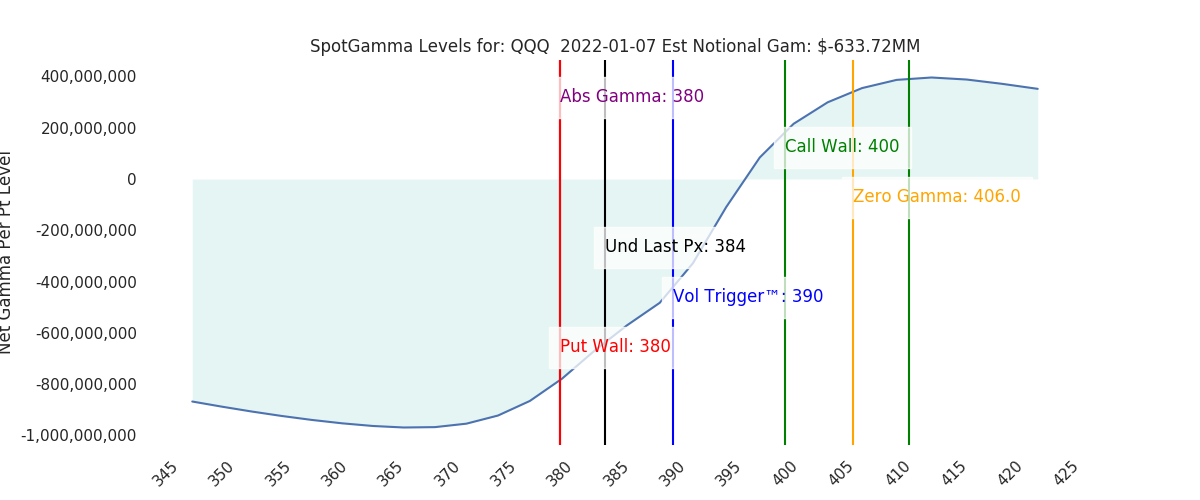
Futures are holding 4700, after testing lows of 4669. Our gamma index forecasts high volatility for today, with an est 1.58% max open/close move. First resistance is the 4725 Vol Trigger line, followed by 4746. To the downside we mark 4666 as support. As this is a negative gamma regime we look for large directional moves in the S&P. We also note a very high level of negative gamma in QQQ, which should add to volatility.
Despite the lack of movement yesterday we believe this is a risky, unstable market. Everything in our data shouts “volatility”, and we find it surprising that a 4700 pin has held. 4700 is the strike which currently holds the most gamma, and what’s interesting about it is that its largely put gamma, and not a notable call strike. This can be seen in the graph below, wherein we plot the strike gamma size by percentile rank. Large put positions is what produces negative gamma in our models.
Puts are also what are most sensitive to implied volatility[IV], and when combined with the negative gamma dealer position – that is the recipe for volatility. We often equate implied volatility to energy, and when there is a high level of IV it indicates that there is a lot of energy stored up. That energy needs to discharge in the form of market movement, a.k.a volatility.
Further, when IV is high, it signals that options are relatively more expensive. Should the market stall out, then the factors of charm play in wherein time decay weights heavily on these puts. The decay of puts should lead to dealers buying back short hedges, which is a catalyst for higher S&P prices which in turns pressures IV lower. This initiates the vanna trade. Its all a feedback loop. That feedback loops works in a declining market, too, wherein higher IV leads to more dealer short hedges which pushes the market lower.
To this “charm” point above we see nearly 30% of total S&P500 gamma expiring today which is a material amount and suggests that hedging flows should produce movement today.
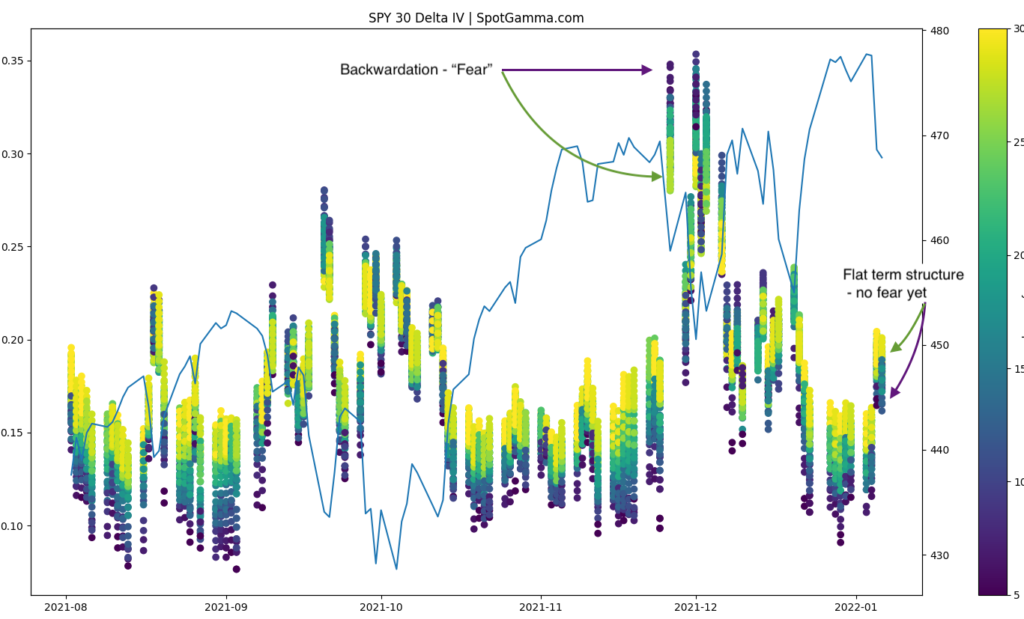
Finally we note that the IV term structure is still somewhat flat. We therefore have this rather volatile situation in gamma terms but shorter dated S&P puts & the VIX aren’t yet involved. When short dated IV shifts above longer dated is when we know that “fear” is in markets. As you can see below that is not the case. Our concern is that if the options market shifts into high hedge demand, and that takes place when the market is in a weakened, negative gamma position.
If the VIX breaks and trends above 20 we look for lower S&P prices, and a test of the 4660 area, but material support is at 4600. If the VIX shifts and trends under 19, we look for a sharp rally into the 4750 area.
| SpotGamma Proprietary Levels | Latest Data | Previous | SPY | NDX | QQQ |
|---|---|---|---|---|---|
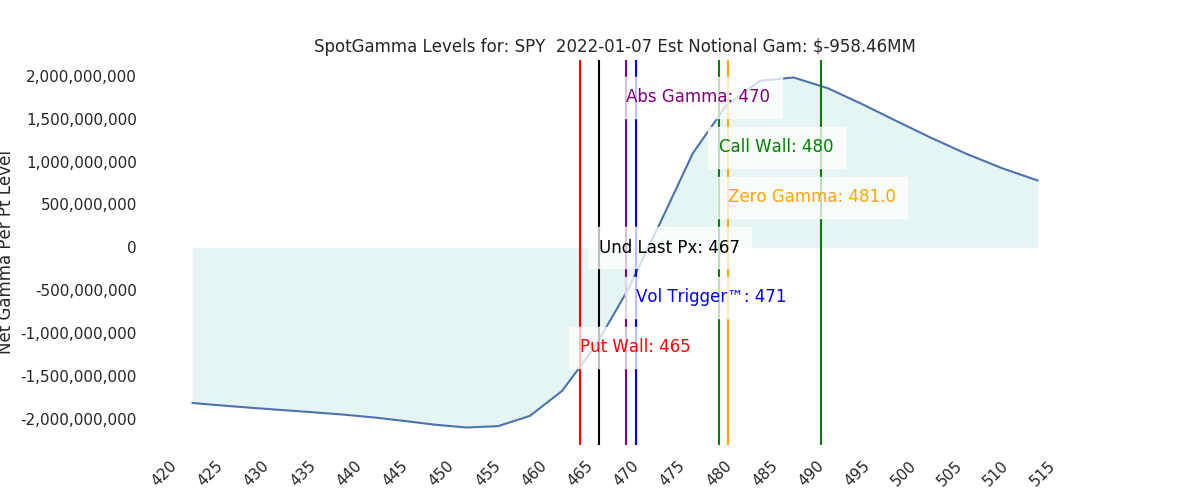
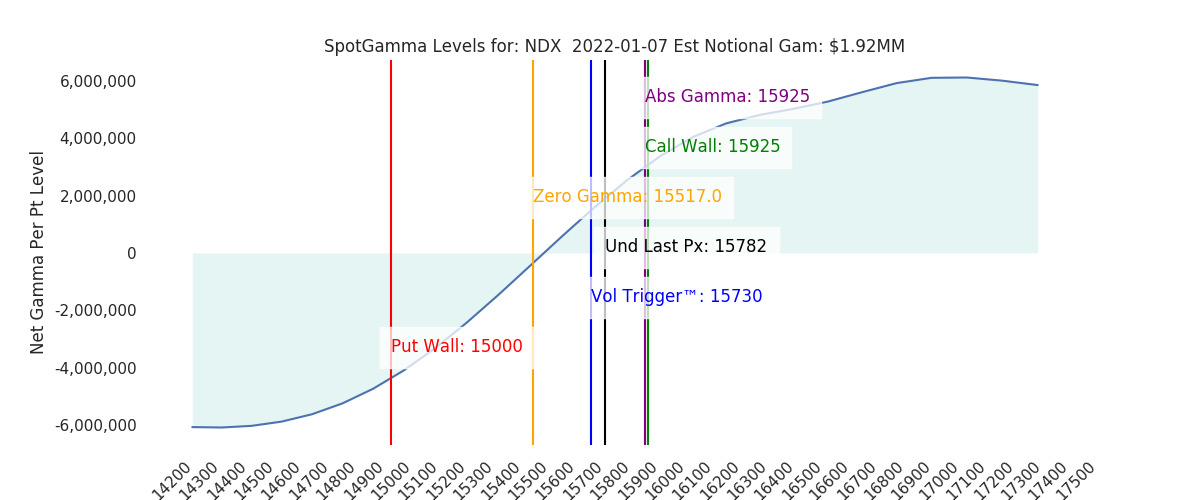
| Ref Price: | 4696 | 4697 | 467 | 15782 | 384 |
| SpotGamma Imp. 1 Day Move: | 1.58%, | Est 1 StdDev Open to Close Range (±pts): 74.0 | |||
| SpotGamma Imp. 5 Day Move: | 1.92% | 4785 (Monday Ref Px) | Range: 4693.0 | 4877.0 | ||
| SpotGamma Gamma Index™: | -0.65 | 0.00 | -0.27 | 0.01 | -0.15 |
| Volatility Trigger™: | 4725 | 200 | 471 | 15730 | 390 |
| SpotGamma Absolute Gamma Strike: | 4700 | 4000 | 470 | 15925 | 380 |
| Gamma Notional(MM): | $-368 | $0 | $-958 | $2 | $-634 |
| Additional Key Levels | Latest Data | Previous | SPY | NDX | QQQ |
|---|---|---|---|---|---|
| Zero Gamma Level: | 4731 | 0 | 0 | 0 | 0 |
| Put Wall Support: | 4700 | 3300 | 465 | 15000 | 380 |
| Call Wall Strike: | 4800 | 4000 | 480 | 15925 | 400 |
| CP Gam Tilt: | 0.85 | 1.14 | 0.74 | 1.18 | 0.62 |
| Delta Neutral Px: | 4603 | ||||
| Net Delta(MM): | $1,493,275 | $19,179 | $172,285 | $35,923 | $97,371 |
| 25D Risk Reversal | -0.08 | -0.08 | -0.07 | -0.08 | -0.08 |
| Key Support & Resistance Strikes: |
|---|
| SPX: [4800, 4700, 4650, 4600] |
| SPY: [470, 468, 465, 460] |
| QQQ: [400, 390, 385, 380] |
| NDX:[16250, 16000, 15925, 15500] |
| SPX Combo (strike, %ile): [4798.0, 4699.0, 4666.0, 4601.0, 4746.0] |
| SPY Combo: [478.26, 468.43, 465.16, 458.61, 473.11] |
| NDX Combo: [15959.0, 15643.0, 15438.0, 15849.0, 15754.0] |