Futures are down slightly to 4660, testing last weeks lows. Our models anticipate high volatility today, with an SG implied move of 1.5% (max range open/close). 4700 and 4663 are resistance lines, with support at 4650 & 4600. QQQ & IWM hold large negative gamma positions, too. We therefore look for a session with large directional swings.
Risk continues to be high as both large negative gamma and high implied volatility [IV] generate price instability.
To the upside we feel that 4700 is clearly defined as resistance. The SPX model from the EquityHub often provides the best levels for downside support, which are shown at 4650 and 4580. This model plots the “rate of change of gamma”, and as there is a sharp change between 4650 and 4580 we believe that hedging flow will be particularly active in that price range.

As there is a big negative gamma position across all major indicies, its put options that are in control of this market. Fridays flow was characterized by traders selling put options, which we think prevented markets from making new lows. This also placed a cap on IV,
We think that put flow is the major influence again, today. If traders seek hedge protection, we will see higher IV (i.e. VIX), and with that dealers will likely need to sell futures to maintain hedges. Conversely a declining IV signals traders are selling puts, and dealers may need to buyback short futures.
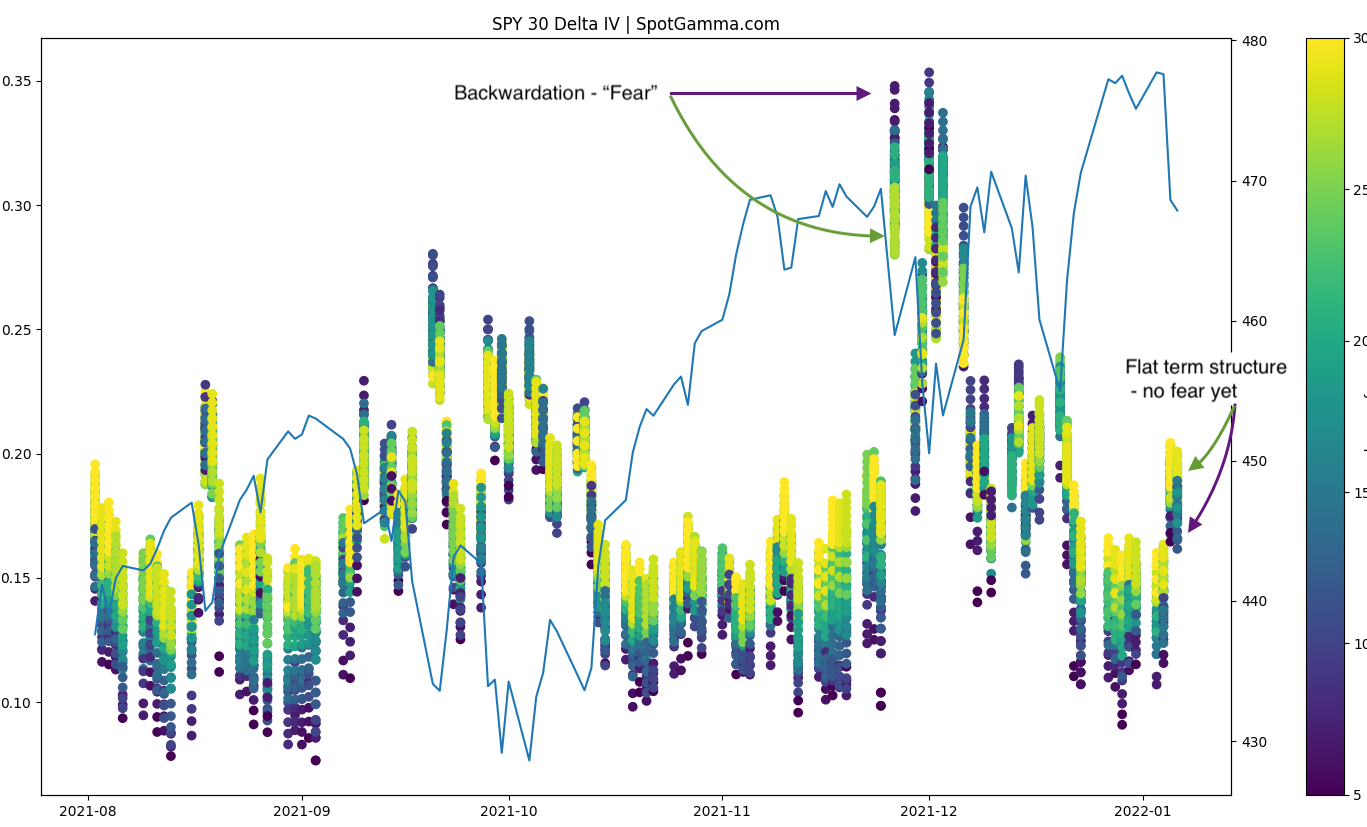
Our predominant concern here is that markets are weak, and predisposed to large price swings – however implied volatility has not yet backwardated. We discussed this on Friday AM (chart here), and note that because puts were sold on Friday that held IV down. Friday could be seen as a tepid short cover rally.
Just consider that with the VIX at 21, it shows traders are anticipating a 1 day move of 1.3%. Our SG models are implying a max move of 1.5%, and if our models are correct that would indicate the VIX should be closer to 25. Should the VIX shift to that 25 level, it would invoke the vanna trade wherein increases in IV lead dealers to sell futures.
This scenario can lead to “gamma trap” feedback loops wherein higher implied volatility leads to dealer selling (vanna hedging), which leads to more put buying, which pushes the market lower. Put buying leads dealers to short more futures (delta hedging), which raises IV.
| SpotGamma Proprietary Levels | Latest Data | Previous | SPY | NDX | QQQ |
|---|---|---|---|---|---|
| Ref Price: | 4673 | 4667 | 465 | 15624 | 379 |
| SpotGamma Imp. 1 Day Move: | 1.5%, | Est 1 StdDev Open to Close Range (±pts): 70.0 | |||
| SpotGamma Imp. 5 Day Move: | 2.83% | 4673 (Monday Ref Px) | Range: 4541.0 | 4805.0 | ||
| SpotGamma Gamma Index™: | -0.66 | -0.64 | -0.26 | 0.00 | -0.13 |
| Volatility Trigger™: | 4705 | 4725 | 469 | 15775 | 386 |
| SpotGamma Absolute Gamma Strike: | 4700 | 4700 | 470 | 15925 | 380 |
| Gamma Notional(MM): | $-421 | $-593 | $-1,047 | $1 | $-631 |
| Additional Key Levels | Latest Data | Previous | SPY | NDX | QQQ |
|---|---|---|---|---|---|
| Zero Gamma Level: | 4707 | 4737 | 0 | 0 | 0 |
| Put Wall Support: | 4600 | 4700 | 460 | 15000 | 355 |
| Call Wall Strike: | 4800 | 4800 | 480 | 15925 | 400 |
| CP Gam Tilt: | 0.84 | 0.71 | 0.69 | 1.09 | 0.6 |
| Delta Neutral Px: | 4580 | ||||
| Net Delta(MM): | $1,459,671 | $1,483,975 | $159,935 | $34,799 | $94,897 |
| 25D Risk Reversal | -0.07 | -0.08 | -0.06 | -0.07 | -0.07 |
| Key Support & Resistance Strikes: |
|---|
| SPX: [4800, 4700, 4650, 4600] |
| SPY: [470, 468, 465, 460] |
| QQQ: [400, 390, 380, 375] |
| NDX:[16250, 16000, 15925, 15000] |
| SPX Combo (strike, %ile): [4794.0, 4598.0, 4612.0, 4696.0, 4663.0] |
| SPY Combo: [478.21, 458.63, 460.03, 468.42, 465.16] |
| NDX Combo: [15965.0, 15637.0, 15434.0, 15230.0, 15559.0] |


