Futures moved lower overnight, with the ES at 4150 and NQ 13200. The SPX holds a marginally positive gamma position which implies a one day move of 82bps. 4150 is showing as a major support line, and we look for a test of 4100 should that break. To the upside we mark 4177 and 4200 as large resistance lines. Watching the VIX/implied volatility will be key today – if VIX moves higher we will likely see markets pressured further. Should the VIX top out early, markets may push back to yesterdays closing levels.
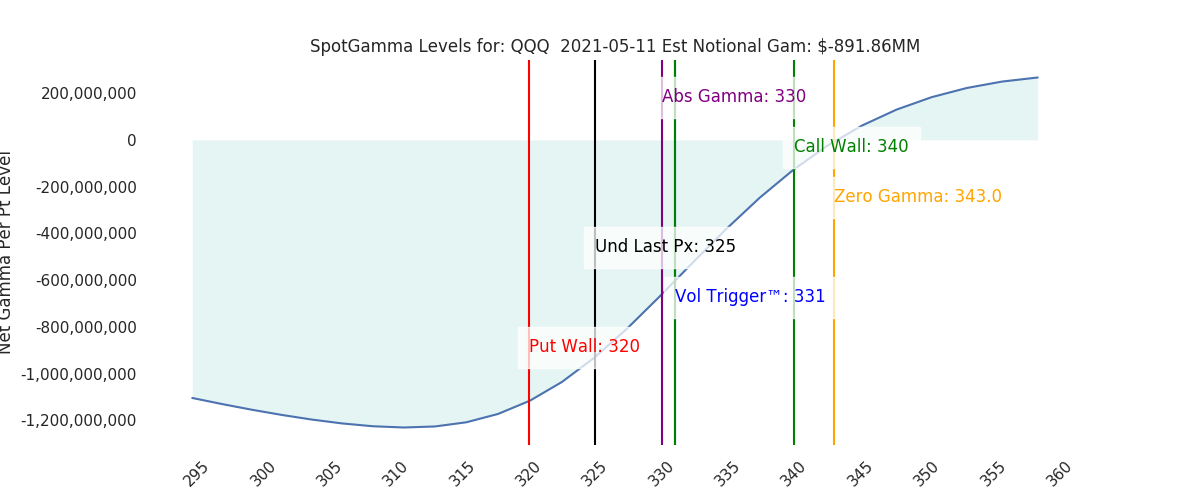
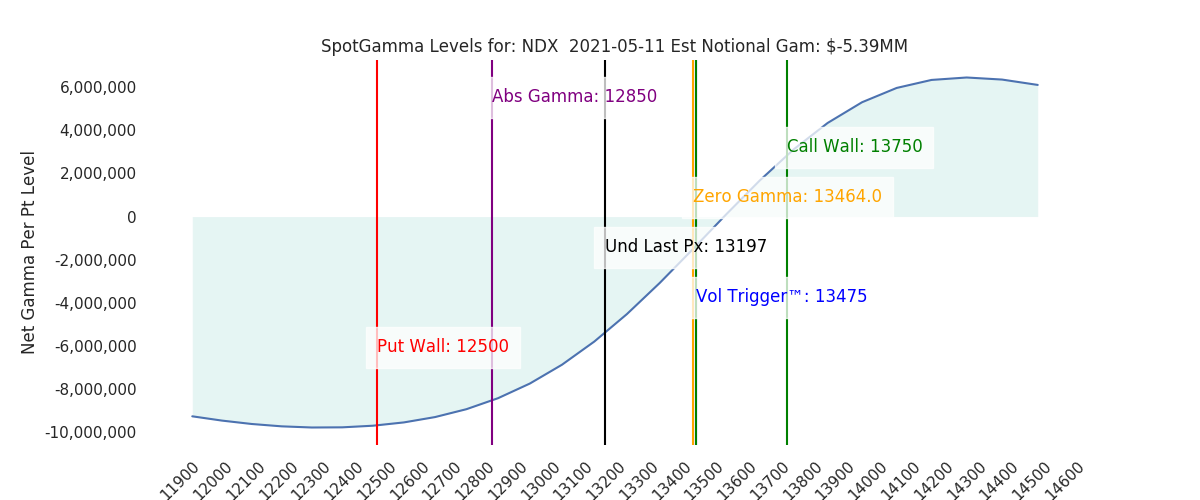
QQQ keeps its robust level of negative gamma, leaving us to look for another large move today. Accordingly, more active traders looking to play long/short may find more movement in the NQ/QQQ vs ES/SPX.
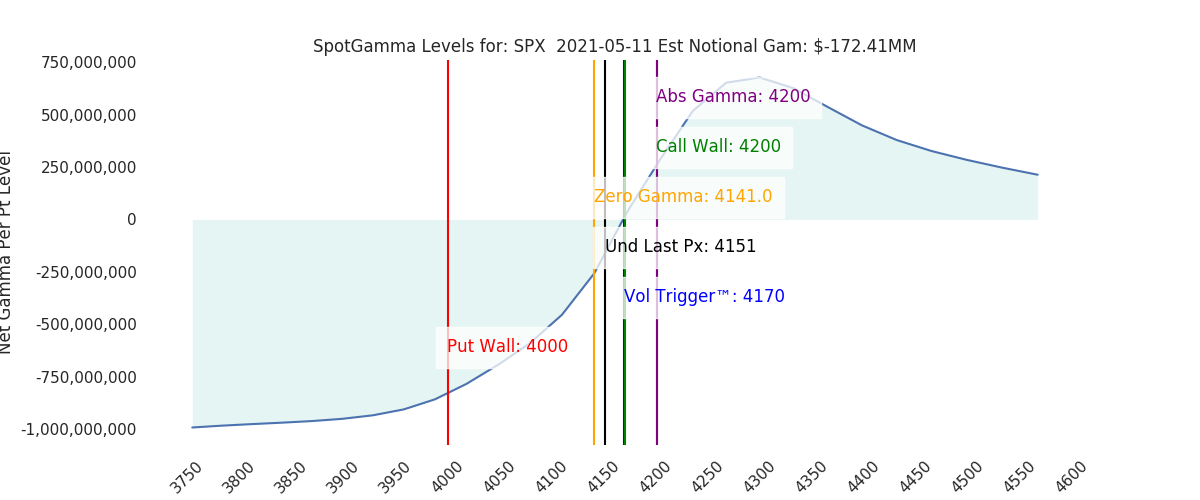
Below we’ve plotted out the QQQ (top) vs SPX gamma (bottom), and you can see how much more “skew” there is in the QQQ model. This supports that view of much larger volatility, both in dealers selling as Nasdaq moves lower and buying if Nasdaq rises.


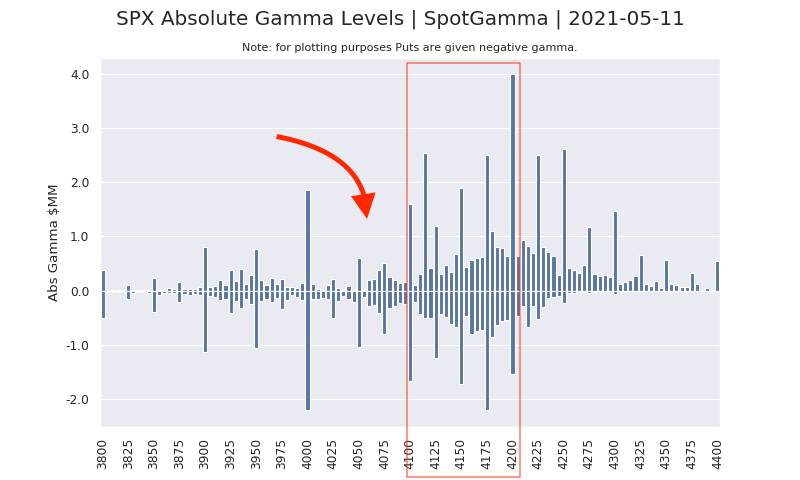
Based on our data, the SPX does not yet seem ready to break for significant volatility. Its been several weeks now wherein we seen fairly decent open interest down to 4100, but a large void exists under 4100 (red arrow, below). This indicates to us that the SPX would quickly revisit the 4000 level on a break of 4100. From this chart you can also see how 4200 stands as a large overhead gamma line.
Model Overview:
4100-4250 is the range into May OPEX. Gamma is currently high which should lead to low volatility. As long as markets are >4170 we anticipate a low volatility market which grinds higher.
| SpotGamma Proprietary Levels | Latest Data | Previous | SPY | NDX | QQQ |
|---|---|---|---|---|---|
| Ref Price: | 4151 | 4181 | 417 | 13197 | 325 |
| SpotGamma Imp. 1 Day Move: | 0.82%, | 34.0 pts | Range: 4117.0 | 4185.0 | ||
| SpotGamma Imp. 5 Day Move: | 4231 | 7.21% | Range: 3926.0 | 4536.0 | ||
| SpotGamma Gamma Index™: | 0.73 | 1.37 | -0.06 | -0.02 | -0.15 |
| Volatility Trigger™(ES Px): | 4170 | 4185 | 418 | 13475 | 331 |
| SpotGamma Absolute Gamma Strike: | 4200 | 4200 | 420 | 12850 | 330 |
| Gamma Notional(MM): | $-172 | $-50 | $-259 | $-5 | $-892 |
| Additional Key Levels | Latest Data | Previous | SPY | NDX | QQQ |
|---|---|---|---|---|---|
| Zero Gamma Level(ES Px): | 4141 | 4170 | 0 | 0 | 0 |
| Put Wall Support: | 4000 | 4175 | 410 | 12500 | 320 |
| Call Wall Strike: | 4200 | 4250 | 421 | 13750 | 340 |
| CP Gam Tilt: | 1.25 | 0.97 | 0.93 | 0.66 | 0.53 |
| Delta Neutral Px: | 4069 | ||||
| Net Delta(MM): | $1,126,804 | $1,422,719 | $200,318 | $35,625 | $87,053 |
| 25D Risk Reversal | -0.1 | -0.06 | -0.07 | -0.09 | -0.08 |
| Top Absolute Gamma Strikes: |
|---|
| SPX: [4200, 4175, 4150, 4000] |
| SPY: [422, 421, 420, 400] |
| QQQ: [335, 330, 325, 320] |
| NDX:[14000, 13750, 13500, 12850] |
| SPX Combo: [4152.0, 4201.0, 4177.0, 4226.0, 4251.0] |
| NDX Combo: [13168.0, 12957.0, 13366.0, 13537.0, 13088.0] |
| Sub Login Support Follow @SpotGamma Strike Charts Historical Chart Gamma Expiration Tool |
0 comentarios