Futures have consolidated some, back to 4365. Yesterdays data shows a reduction in negative gamma across both the S&P & QQQ which leads to slightly lower volatility expectations for today (1.36% open/close max move). Resistance strikes are at 4405 & 4453. Support lies at 4356 and 4308.
While we see a reduction in gamma, the volatility forecasts remain quite high. Today we look for wide price swings, but feel it will mainly be noise. Prices will remain unstable until implied volatility declines & puts are removed.
As stated on numerous occasions, we do not think either of these variables shift until after Wednesdays FOMC.
Yesterdays session was certainly remarkable. We had given edge to a market rally (SPX closed +28bps) – but that was not quite the path we had anticipated (~3% intraday decline). It certainly felt as if the market was stuck in a series of feedback loops, which makes sense given the large negative gamma position. The downside loop was broken as put sellers appeared mid day, and that sparked an upside loop wherein puts were sold and implied volatility dropped (more here).
On the 21st we discussed this idea of “max negative gamma” wherein the distribution of prices appears to reduce when our SG Gamma Index pushes beyond -2. We opined that this may be due to the fact that dealers own tail risk, and so when declines hit an extreme (ie VIX 35) it may reduce dealer hedging demands . Said another way – dealers may not need to sell futures if their long out-of-the-money put options jump in value (we’ll write about this separately).
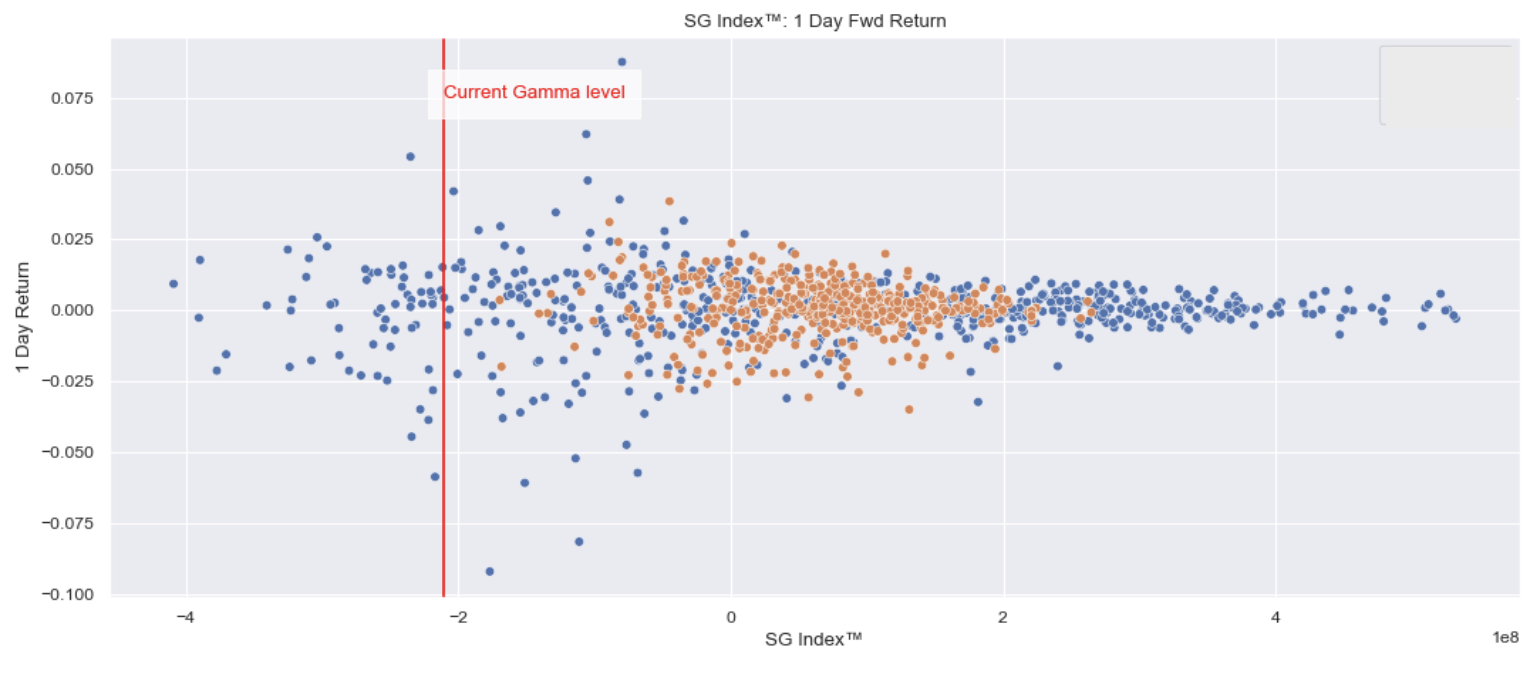
We also noticed another interesting element this morning. Below is yesterdays gamma chart of QQQ, and you can see that the graph implied that as QQQ down to $340, that the gamma hedging demand tailed off. This is likely not something that would spark a rally, but it would (in theory) reduce the fuel driving that downward negative gamma feedback loop. Note the gamma profile in the S&P flattened out into 4200 vs SPX lows of 4220.

| SpotGamma Proprietary Levels | Latest Data | Previous | SPY | NDX | QQQ |
|---|---|---|---|---|---|
| Ref Price: | 4359 | 4408 | 440 | 14306 | 353 |
| SpotGamma Imp. 1 Day Move: | 1.36%, | Est 1 StdDev Open to Close Range (±pts): 59.0 | |||
| SpotGamma Imp. 5 Day Move: | 3.7% | 4384 (Monday Ref Px) | Range: 4223.0 | 4547.0 | ||
| SpotGamma Gamma Index™: | -1.20 | -1.66 | -0.21 | -0.01 | -0.10 |
| Volatility Trigger™: | 4590 | 4590 | 455 | 14775 | 367 |
| SpotGamma Absolute Gamma Strike: | 4600 | 4600 | 450 | 14800 | 350 |
| Gamma Notional(MM): | $-753 | $-756 | $-832 | $-1 | $-568 |
| Additional Key Levels | Latest Data | Previous | SPY | NDX | QQQ |
|---|---|---|---|---|---|
| Zero Gamma Level: | 4595 | 4611 | 0 | 0 | 0 |
| Put Wall Support: | 4200 | 4300 | 425 | 13500 | 350 |
| Call Wall Strike: | 4800 | 4800 | 480 | 14800 | 400 |
| CP Gam Tilt: | 0.66 | 0.56 | 0.66 | 0.83 | 0.53 |
| Delta Neutral Px: | 4538 | ||||
| Net Delta(MM): | $1,479,354 | $1,493,383 | $174,935 | $36,084 | $99,008 |
| 25D Risk Reversal | -0.12 | -0.1 | -0.11 | -0.12 | -0.12 |
| Key Support & Resistance Strikes: |
|---|
| SPX: [4600, 4500, 4300, 4000] |
| SPY: [450, 445, 440, 430] |
| QQQ: [375, 360, 355, 350] |
| NDX:[15300, 15000, 14800, 13500] |
| SPX Combo (strike, %ile): [4356.0, 4308.0, 4404.0, 4453.0, 4330.0] |
| SPY Combo: [435.22, 430.4, 440.04, 444.86, 432.59] |
| NDX Combo: [14186.0, 14601.0, 14386.0, 13986.0] |


