Futures are near overnight lows of 4405, down from highs near 4440. The updated data shows a reduction in negative gamma, which leads to a slightly reduced volatility forecast today. We also note that our Vol Trigger[VT] (SG’s proprietary gamma flip level) has shifted down sharply to 4410.
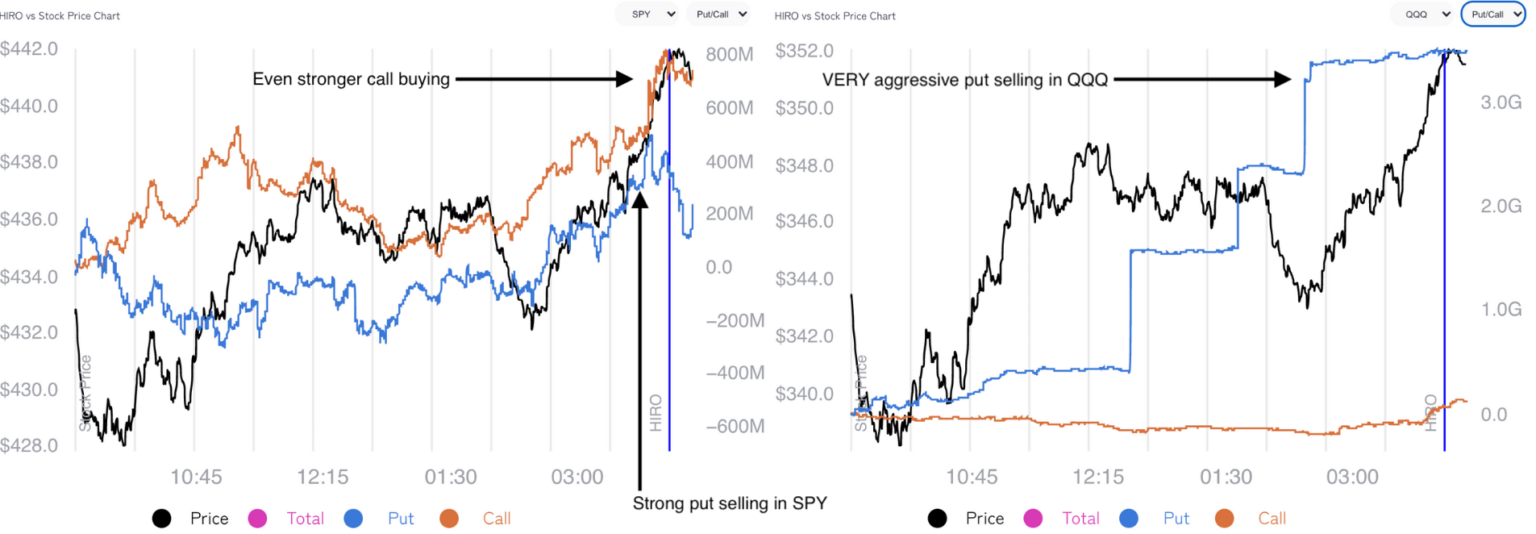
The VT shift and reduction in negative gamma is the result of some in-the-money puts being closed on Friday. You can see this in the SPX chart below, and we saw a similar change for SPY. The put closure seemed to be more tied to expiration that intraday trading, with the exception of some large QQQ puts as highlighted in the Friday PM note.

Along with reducing our gamma-based volatility forecast, we’ve long viewed the closing of puts as bullish for equities. Its clear that on Friday some puts were closed, but it did not seem particularly material.
There is another view into this put activity from the OCC, as shown below. As you can see,there was some signs of net put selling in Index(red line), ETF(brown) and equities(yellow), but well off of levels from major declines in the past (March ’20, Dec ’18). If you review our twitter thread, you can also see that there is little desire to short puts which appears to coincide with major lows.

The net of all this is that, yes, some puts have been closed. However, we see little signal that traders are about to release the bulk of their protection, much less short volatility with size. Therefore, there is still plenty of fuel for a short cover rally fueled by put covering. Equally important, it seems now that the “lower bound” has rolled down toward 4100SPX & 430 in QQQ.
We should note the bulk of put positions continues to be tied to 2/18 expiration.
If the market holds 4400 we believe implied volatility will trend lower, which adds a tailwind to equities through vanna flows.
| SpotGamma Proprietary Levels | Latest Data | Previous | SPY | NDX | QQQ |
|---|---|---|---|---|---|
| Ref Price: | 4437 | 4419 | 441 | 14481 | 351 |
| SpotGamma Imp. 1 Day Move: | 1.17%, | Est 1 StdDev Open to Close Range (±pts): 52.0 | |||
| SpotGamma Imp. 5 Day Move: | 5.69% | 4437 (Monday Ref Px) | Range: 4185.0 | 4689.0 | ||
| SpotGamma Gamma Index™: | -0.60 | -1.70 | -0.19 | -0.00 | -0.11 |
| Volatility Trigger™: | 4410 | 4530 | 450 | 14775 | 366 |
| SpotGamma Absolute Gamma Strike: | 4400 | 4300 | 450 | 14800 | 350 |
| Gamma Notional(MM): | $-339 | $-408 | $-824 | $0 | $-610 |
| Additional Key Levels | Latest Data | Previous | SPY | NDX | QQQ |
|---|---|---|---|---|---|
| Zero Gamma Level: | 4535 | 4517 | 0 | 0 | 0 |
| Put Wall Support: | 4200 | 4300 | 425 | 13500 | 350 |
| Call Wall Strike: | 4700 | 4700 | 460 | 14800 | 400 |
| CP Gam Tilt: | 0.84 | 0.77 | 0.68 | 0.99 | 0.53 |
| Delta Neutral Px: | 4515 | ||||
| Net Delta(MM): | $1,539,085 | $1,598,474 | $170,030 | $38,435 | $98,534 |
| 25D Risk Reversal | -0.1 | -0.1 | -0.09 | -0.11 | -0.1 |
| Key Support & Resistance Strikes: |
|---|
| SPX: [4600, 4500, 4400, 4300] |
| SPY: [450, 440, 430, 425] |
| QQQ: [365, 360, 350, 340] |
| NDX:[15300, 15000, 14800, 14000] |
| SPX Combo (strike, %ile): [4351.0, 4439.0, 4497.0, 4359.0, 4510.0] |
| SPY Combo: [433.99, 442.83, 448.58, 434.88, 449.91] |
| NDX Combo: [14842.0, 14421.0, 14218.0] |


