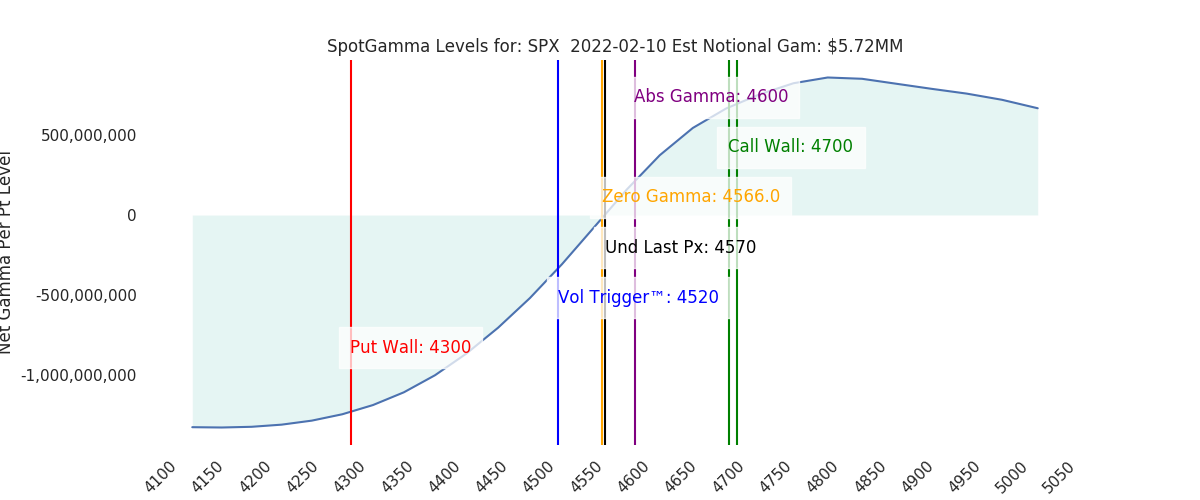
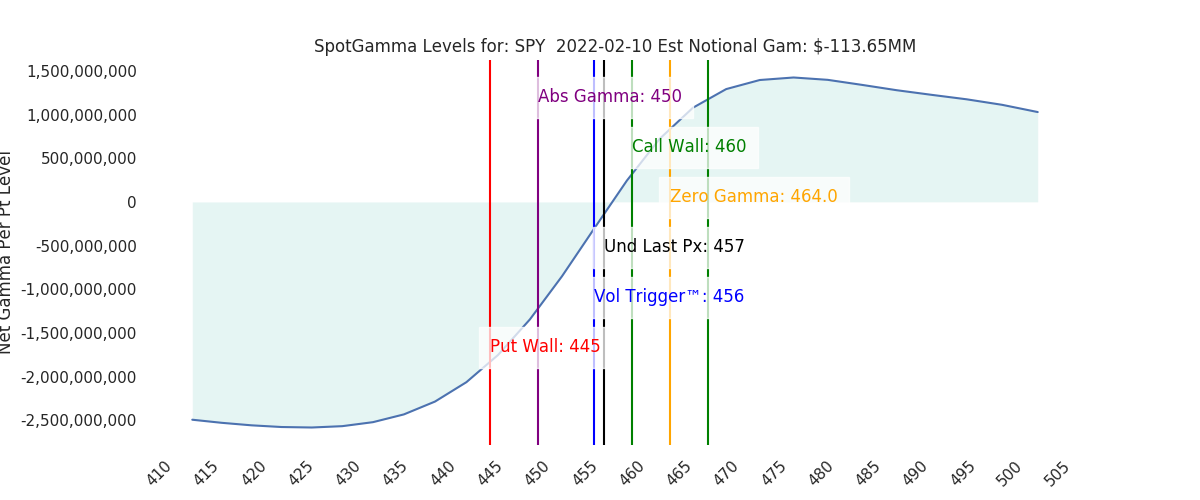
Futures are flat ahead of the 8:30AM ET CPI report. Our volatility forecast declined sharply to 0.67% today (1 stdev move, open/close) vs 1.2% y’day. We see large support at 4520, with resistance remaining at 4600 and 4620 (SPY 460 equivalent).
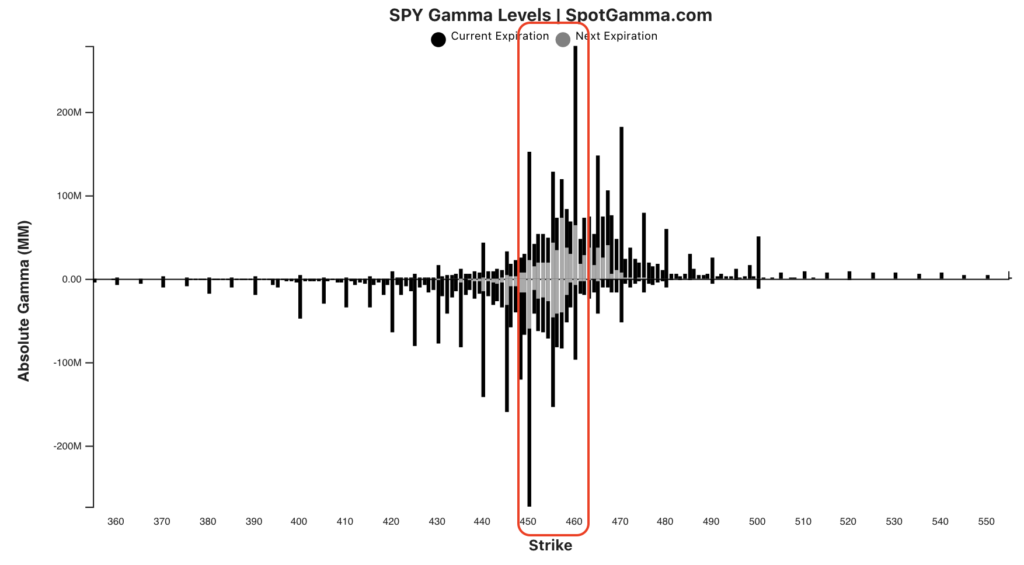
While many traders are watching this data point closely, we feel that it won’t have much short term impact due to the change in options hedging positions. We saw a clear increase in gamma at the 460SPY/4600SPX strike yesterday which we think further “boxes in” todays price action (yesterdays chart). It would take a major data surprise to dislodge markets from this 4520 to 4600 area.
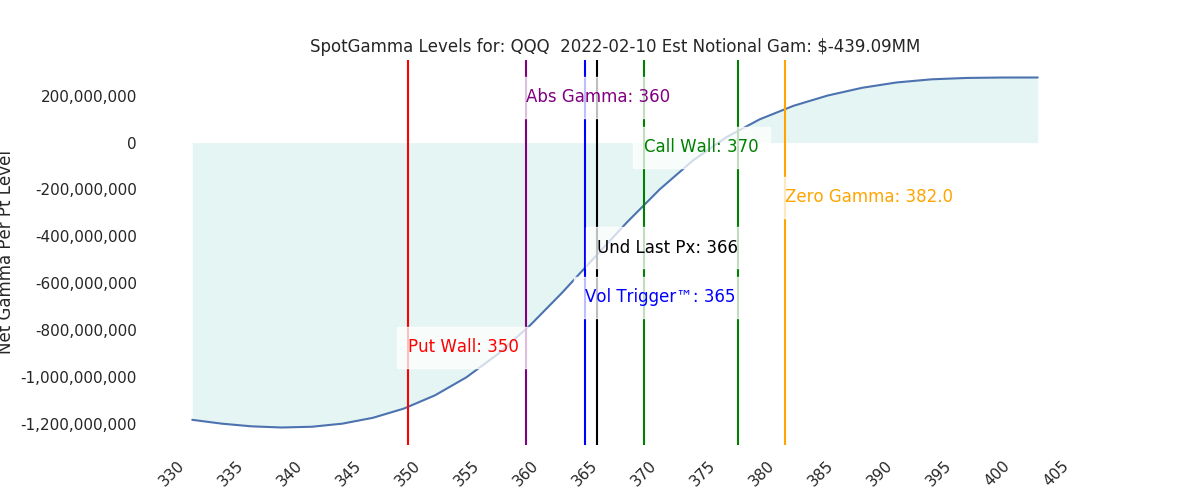
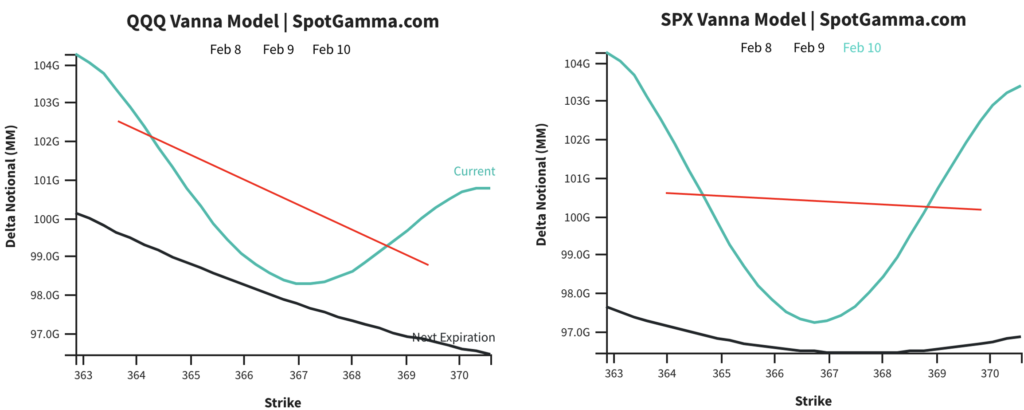
While the S&P holds a fairly neutral position, we still see some volatility-inducing positions in tech. This is shown through the vanna model below, wherein the QQQ model (left) has a steep tilt compared to the SPX model (right). The suggestion here is that dealers have QQQ to sell on declines, and QQQ to buy on rallies. This invokes higher relative volatility to the more neutral S&P.
In a longer term (i.e. multi day) context, as long as the S&P holds our Vol Trigger level, we give edge to markets pushing higher. Our base assumption for today is that the “event volatility” around the CPI number burns off, which kicks in positive vanna flows and gamma hedging into the 4600 area. This would signal a continued rotation in options positions to higher strikes which drags markets up.
For the downside, based on today’s volatility estimate it would likely take multiple sessions to initiate a major selloff from here – we’d first have to stage today down near the 4500 line (~1% lower) which would position the market for a more significant decline tomorrow. In other words: due to the gamma position we see less downside tail risk for today.
| SpotGamma Proprietary Levels | Latest Data | Previous | SPY | NDX | QQQ |
|---|---|---|---|---|---|
| Ref Price: | 4570 | 4575 | 457 | 15001 | 366 |
| SpotGamma Imp. 1 Day Move: | 0.67%, | Est 1 StdDev Open to Close Range (±pts): 31.0 | |||
| SpotGamma Imp. 5 Day Move: | 4.23% | 4489 (Monday Ref Px) | Range: 4300.0 | 4679.0 | ||
| SpotGamma Gamma Index™: | 0.64 | -0.15 | -0.02 | 0.03 | -0.08 |
| Volatility Trigger™: | 4520 | 4520 | 456 | 14790 | 365 |
| SpotGamma Absolute Gamma Strike: | 4600 | 4600 | 450 | 14800 | 360 |
| Gamma Notional(MM): | $6 | $-59 | $-114 | $3 | $-439 |
| Additional Key Levels | Latest Data | Previous | SPY | NDX | QQQ |
|---|---|---|---|---|---|
| Zero Gamma Level: | 4566 | 4542 | 0 | 0 | 0 |
| Put Wall Support: | 4300 | 4400 | 445 | 14000 | 350 |
| Call Wall Strike: | 4700 | 4700 | 460 | 14800 | 370 |
| CP Gam Tilt: | 1.16 | 0.95 | 0.96 | 1.29 | 0.72 |
| Delta Neutral Px: | 4513 | ||||
| Net Delta(MM): | $1,611,242 | $1,552,023 | $171,398 | $42,670 | $96,071 |
| 25D Risk Reversal | -0.08 | -0.08 | -0.07 | -0.09 | -0.08 |
| Key Support & Resistance Strikes: |
|---|
| SPX: [4700, 4650, 4600, 4500] |
| SPY: [470, 460, 455, 450] |
| QQQ: [375, 370, 360, 350] |
| NDX:[15300, 15175, 15000, 14800] |
| SPX Combo (strike, %ile): [4690.0, 4589.0, 4640.0, 4663.0, 4603.0] |
| SPY Combo: [468.78, 458.72, 463.75, 466.04, 460.09] |
| NDX Combo: [14738.0, 14723.0, 15128.0, 15338.0, 15203.0] |