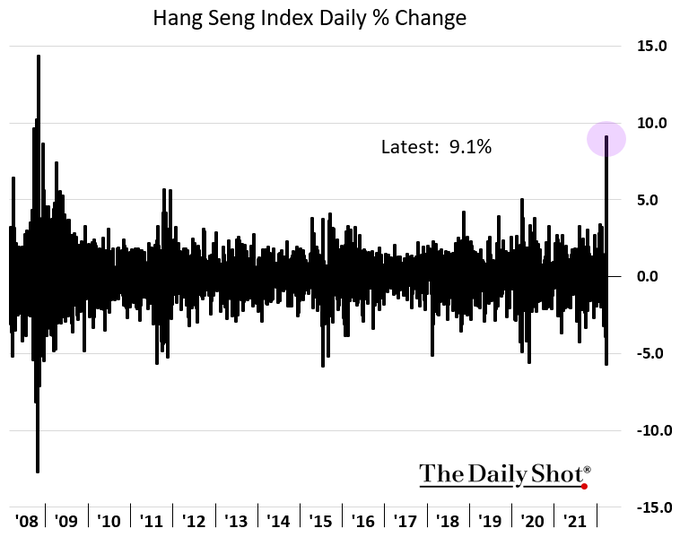
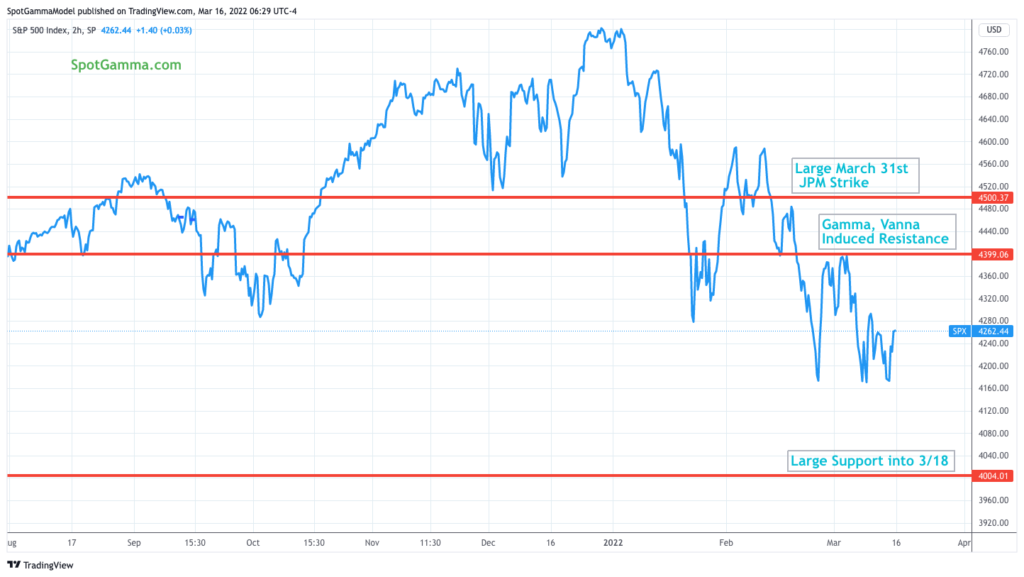
Future are up sharply overnight to 4308, driven by large stimulus out of China (see image below). We’d anticipate 4300-4315 (SPY 430) acting as resistance into the 2pm ET FOMC meeting today. After 2pm we look for high volatility as traders adjust to the Fed’s statements. Above 4315 our main resistance line is 4400. To the downside we see 4220 as support.
As we discussed on Monday there is some path dependency to a rally, and this overnight move pulls forward some of the post-FOMC/OPEX fuel we’ve been highlighting. As we’ve mapped out below, there are 3 key areas of interest. Should the Fed appease markets, we think it triggers the release of a lot of pent-up implied volatility & short covering. With such a large put position tied to Friday’s expiration, this type of rally could smash those 3/18 put values which could remove a lot of the OPEX fuel.
Should the market breach 4400, we’d look for positive gamma and declining implied volatility (i.e. vanna fllows) to start suppressing volatility (as opposed to expanding it, as per last several weeks). Currently we see 4500 as a top due to the large call interest positioned there, and a big chunk of that is tied to 3/31 expiration (JPM Collar).
This expiration clears out >1/3 of gamma and >1/4 of total deltas in S&P/QQQ. Additionally, we note that ~50% of single stocks have their largest gamma position expiring Friday. Pertaining to single stocks – in this environment we view dealers and market makers as having a predominantly negative gamma position, the hedging of which drives volatility. With expiration, hedging flows & associated volatility should be reduced into next week.
Conversely should the Fed disappoint, we see the 4000-4050 area as major support into 3/18-3/21. A sharp move lower would reload put values, and the expiration of larger put values could lead to a sharp, short-hedge-cover rally early next week.
For the longer term, we remained quite concerned that this OPEX and FOMC is serving to clear out many of the put hedges that have buoyed markets since early March. Our view has been that it is these hedges which have prevented a real “tail” move lower in equities (despite high vol in other assets). Therefore looking out towards the end of March the removal of large puts may allow for lower lows.
| SpotGamma Proprietary Levels | Latest Data | Previous | SPY | NDX | QQQ |
|---|---|---|---|---|---|
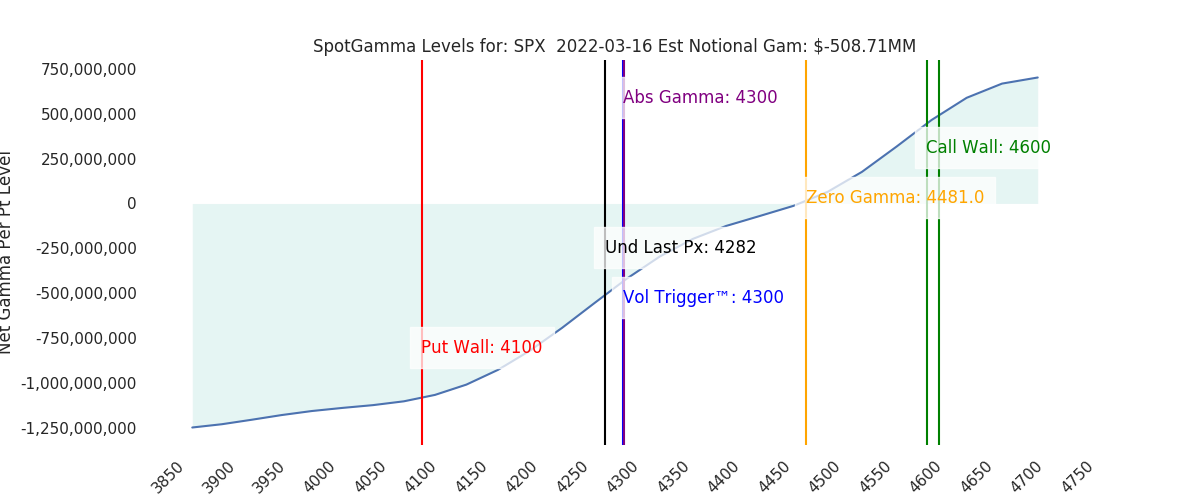
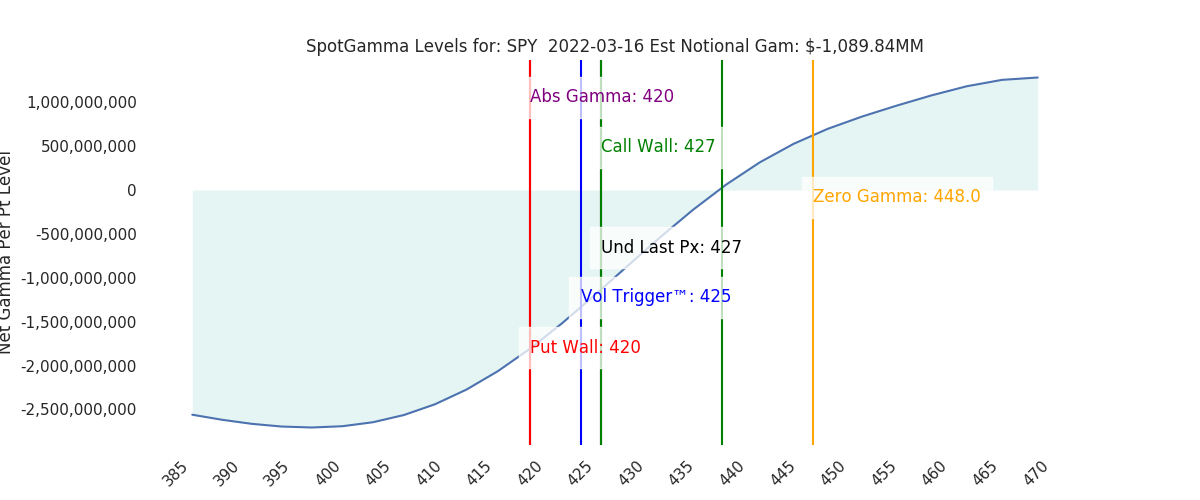
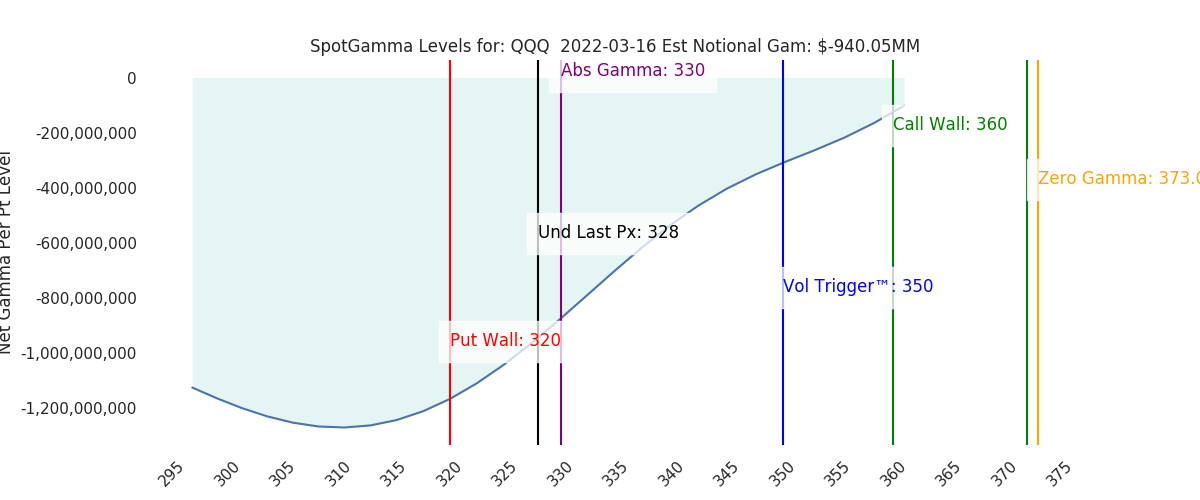
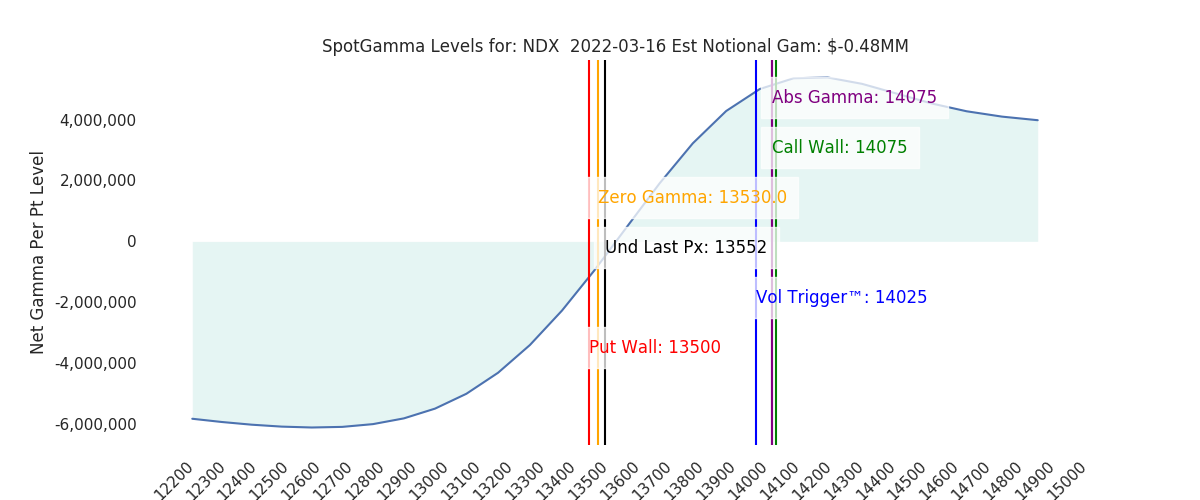
| Ref Price: | 4282 | 4261 | 427 | 13552 | 328 |
| SpotGamma Imp. 1 Day Move: | 1.37%, | Est 1 StdDev Open to Close Range (±pts): 59.0 | |||
| SpotGamma Imp. 5 Day Move: | 3.52% | 4224 (Monday Ref Px) | Range: 4076.0 | 4373.0 | ||
| SpotGamma Gamma Index™: | -1.14 | -1.66 | -0.25 | -0.02 | -0.16 |
| Volatility Trigger™: | 4300 | 4330 | 425 | 14025 | 350 |
| SpotGamma Absolute Gamma Strike: | 4300 | 4000 | 420 | 14075 | 330 |
| Gamma Notional(MM): | $-509 | $-476 | $-1,090 | $0 | $-940 |
| Additional Key Levels | Latest Data | Previous | SPY | NDX | QQQ |
|---|---|---|---|---|---|
| Zero Gamma Level: | 4481 | 4392 | 0 | 0 | 0 |
| Put Wall Support: | 4100 | 4100 | 420 | 13500 | 320 |
| Call Wall Strike: | 4600 | 4400 | 427 | 14075 | 360 |
| CP Gam Tilt: | 0.74 | 0.75 | 0.63 | 0.96 | 0.46 |
| Delta Neutral Px: | 4391 | ||||
| Net Delta(MM): | $1,892,179 | $1,600,171 | $176,306 | $43,595 | $114,911 |
| 25D Risk Reversal | -0.09 | -0.08 | -0.1 | -0.09 | -0.1 |
| Key Support & Resistance Strikes: |
|---|
| SPX: [4400, 4350, 4300, 4200] |
| SPY: [435, 430, 425, 420] |
| QQQ: [330, 325, 320, 315] |
| NDX:[14075, 14000, 13500, 13000] |
| SPX Combo (strike, %ile): [(4220.0, 8.31)] |
| SPY Combo: [415.09, 419.78, 430.01, 424.89, 422.33] |
| NDX Combo: [13236.0, 13439.0, 13657.0, 13616.0] |